In Singapore, HDB flats are public housing. They are meant to be affordable and for the masses since 77.2% of Singapore residents live in HDB (Housing & Development Board) flats.
The average cost of housing has been increasing (and thus is one of the good asset classes that generate wealth). Are properties as affordable now as they were intended to be?
The first ever transaction of an HDB flat being sold for at least $1 million was in 2012. Since then, records have been continuously broken.
In this report, we look at trends and statistics on million-dollar HDB resale flats in Singapore, including how many were transacted in 2025 and over the past years, locations of these homes, the types of flats (4-room, 5-room, etc) sold, and more.
- Top Million-Dollar HDB Flats Statistics
- Million-Dollar HDB Resale Flats in 2025
- Million-Dollar HDB Resale Flats in 2024
- Million-Dollar HDB Resale Flats in 2023
- Million-Dollar HDB Flats Over Time
- Most Expensive HDB Flat
- Locations of Million-Dollar HDB Flats
- Flat Types of HDB Flats Sold for $1 Million or More
Top Million-Dollar HDB Flats Statistics
- 1,594 HDB flats were sold for $1 million or more in 2025. This is another record-breaking year, with that figure being 54% higher than that of 2024
- Million-dollar transactions remained a minority, making up just 6.35% of all HDB resale transactions in 2025
- 1,035 HDB flats were sold for at least $1 million in 2024
- 470 HDB flats were sold for at least $1 million in 2023
- A total of 4,029 million-dollar HDB flats have been sold
- The first million-dollar transaction was in July 2012
- The most expensive HDB flat was sold for $1,658,888 in June 2025
- The top 5 areas with the most million-dollar transactions are Toa Payoh, Bukit Merah, Queenstown, Kallang/Whampoa, and Bishan
- Out of 27 HDB towns and estates, only 4 towns have not seen million-dollar transactions, namely, Chua Chu Kang, Jurong West, Sembawang, and Tengah
SIDE NOTE
A policy bought years ago. Savings in three places. A will that's still on the to-do list.
None of it is wrong. It's just not a plan yet.
There's an order that turns the pieces into one system, and it doesn't require becoming a finance expert. Here's the order, in 7 steps, so you know what to sort out first.
Million-Dollar HDB Resale Flats in 2025
A record-breaking 1,594 HDB resale flats were sold for $1 million or more in 2025. This figure is 54% higher than the number recorded in 2024, marking another milestone year for the market.

In 2025, there were 25,092 HDB resale transactions, of which 1,594 were valued at $1 million or more, representing 6.35% of the total.
Below shows further details of those transactions:
| HDB Town/Estate | 4-Room | 5-Room | Executive | Multi-Gen | Others | Total |
|---|---|---|---|---|---|---|
| Ang Mo Kio | 24 | 45 | 12 | 81 | ||
| Bedok | 11 | 28 | 39 | |||
| Bishan | 7 | 52 | 38 | 1 | 98 | |
| Bukit Batok | 4 | 4 | 8 | |||
| Bukit Merah | 110 | 106 | 216 | |||
| Bukit Panjang | 11 | 11 | ||||
| Bukit Timah | 14 | 9 | 23 | |||
| Central | 38 | 17 | 55 | |||
| Chua Chu Kang | – | |||||
| Clementi | 52 | 44 | 10 | 106 | ||
| Geylang | 38 | 14 | 10 | 62 | ||
| Hougang | 7 | 38 | 45 | |||
| Jurong East | 16 | 16 | ||||
| Jurong West | – | |||||
| Kallang/Whampoa | 86 | 51 | 8 | 2 | 147 | |
| Marine Parade | 15 | 15 | ||||
| Pasir Ris | 20 | 20 | ||||
| Punggol | 4 | 4 | ||||
| Queenstown | 114 | 53 | 6 | 173 | ||
| Sembawang | – | |||||
| Sengkang | 10 | 1 | 11 | |||
| Serangoon | 6 | 44 | 50 | |||
| Tampines | 11 | 56 | 1 | 68 | ||
| Tengah | – | |||||
| Toa Payoh | 195 | 93 | 14 | 302 | ||
| Woodlands | 29 | 29 | ||||
| Yishun | 14 | 1 | 15 | |||
| Total | 664 | 557 | 368 | 3 | 2 | 1,594 |
Of the 1,594 flats, 664 were 4-room, 557 were 5-room, 368 were executive, 3 were multi-generation, and 2 were terraces (others).
The top 3 areas where most transactions happened were in Toa Payoh, Bukit Merah, and Queenstown.
Million-Dollar HDB Resale Flats in 2024
1,035 HDB resale flats were sold for $1 million or more in 2024.
Below shows further details of those transactions:
| HDB Town/Estate | 4-Room | 5-Room | Executive | Multi-Gen | Others | Total |
|---|---|---|---|---|---|---|
| Ang Mo Kio | 13 | 43 | 11 | 67 | ||
| Bedok | 5 | 20 | 25 | |||
| Bishan | 3 | 38 | 37 | 78 | ||
| Bukit Batok | 1 | 2 | 3 | |||
| Bukit Merah | 55 | 80 | 135 | |||
| Bukit Panjang | 9 | 9 | ||||
| Bukit Timah | 12 | 12 | 24 | |||
| Central | 30 | 17 | 47 | |||
| Chua Chu Kang | – | |||||
| Clementi | 13 | 27 | 12 | 52 | ||
| Geylang | 23 | 18 | 9 | 50 | ||
| Hougang | 3 | 28 | 31 | |||
| Jurong East | 6 | 6 | ||||
| Jurong West | – | |||||
| Kallang/Whampoa | 106 | 39 | 7 | 4 | 156 | |
| Marine Parade | 5 | 5 | ||||
| Pasir Ris | 5 | 5 | ||||
| Punggol | 3 | 3 | ||||
| Queenstown | 65 | 40 | 4 | 109 | ||
| Sembawang | – | |||||
| Sengkang | 2 | 2 | 4 | |||
| Serangoon | 3 | 26 | 29 | |||
| Tampines | 20 | 2 | 22 | |||
| Tengah | – | |||||
| Toa Payoh | 73 | 56 | 15 | 144 | ||
| Woodlands | 22 | 22 | ||||
| Yishun | 7 | 2 | 9 | |||
| Total | 381 | 392 | 254 | 4 | 4 | 1,035 |
Of the 1,035 flats, 381 were 4-room, 392 were 5-room, 254 were executive, 4 were multi-generation, and 4 were terraces (others).
The top 3 areas where most transactions happened were in Kallang/Whampoa, Toa Payoh, and Bukit Merah.
Million-Dollar HDB Resale Flats in 2023
470 HDB resale flats were sold for $1 million or more in 2023.
Below shows further details of those transactions:
| HDB Town/Estate | 4-Room | 5-Room | Executive | Multi-Gen | Others | Total |
|---|---|---|---|---|---|---|
| Ang Mo Kio | 3 | 21 | 7 | 31 | ||
| Bedok | 3 | 6 | 9 | |||
| Bishan | 8 | 6 | 31 | 45 | ||
| Bukit Batok | 4 | 4 | ||||
| Bukit Merah | 19 | 43 | 62 | |||
| Bukit Panjang | 1 | 1 | ||||
| Bukit Timah | 6 | 8 | 14 | |||
| Central | 36 | 11 | 1 | 48 | ||
| Chua Chu Kang | – | |||||
| Clementi | 2 | 22 | 7 | 31 | ||
| Geylang | 8 | 3 | 11 | |||
| Hougang | 5 | 5 | ||||
| Jurong East | 6 | 6 | ||||
| Jurong West | – | |||||
| Kallang/Whampoa | 21 | 23 | 7 | 3 | 54 | |
| Marine Parade | 5 | 5 | ||||
| Pasir Ris | 2 | 2 | ||||
| Punggol | 2 | 2 | ||||
| Queenstown | 24 | 18 | 6 | 48 | ||
| Sembawang | – | |||||
| Sengkang | – | |||||
| Serangoon | 15 | 15 | ||||
| Tampines | 1 | 1 | 2 | |||
| Tengah | – | |||||
| Toa Payoh | 12 | 33 | 12 | 57 | ||
| Woodlands | 14 | 14 | ||||
| Yishun | 3 | 1 | 4 | |||
| Total | 125 | 202 | 139 | 1 | 3 | 470 |
Of the 470 flats, 125 were 4-room, 202 were 5-room, 139 were executive, 1 was multi-generation, and 3 were terraces (others).
The top 3 areas where most transactions happened were in Bukit Merah, Toa Payoh, and Kallang/Whampoa.
Million-Dollar HDB Flats Over Time
The first ever million-dollar HDB flat transaction was in Jul 2012. It was an executive flat that sold for $1,000,000. The unit was between 16-18 stories at Blk 149 Mei Ling Street located in Queenstown, and had a space of 150 sqm.
Since then, yearly sales of million-dollar HDB flats have almost always increased.
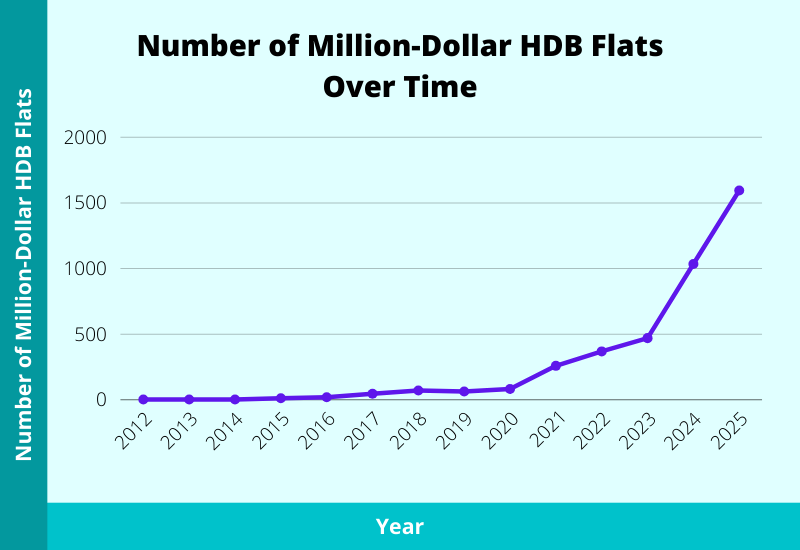
A total of 4,029 HDB resale flats were sold for at least $1 million, from the very first transaction in 2012 to December 2025.
| Year | Number of Million-Dollar HDB Flats |
|---|---|
| 2012 | 2 |
| 2013 | 3 |
| 2014 | 2 |
| 2015 | 12 |
| 2016 | 20 |
| 2017 | 46 |
| 2018 | 71 |
| 2019 | 64 |
| 2020 | 82 |
| 2021 | 259 |
| 2022 | 369 |
| 2023 | 470 |
| 2024 | 1,035 |
| 2025 | 1,594 |
| Total | 4,029 |
Million-dollar HDB transactions have surged since 2021, when sales tripled to 259.
This momentum continued as figures quadrupled 2020 levels in 2022 (369), reached 470 in 2023, and doubled again to 1,035 in 2024.
By 2025, a new record of 1,594 transactions was set, a 54% increase over the previous year.
QUICK CHECK
Can you answer these three questions?
1) If something happened to you tomorrow, how much would your family receive?
2) At 65, what monthly income will your savings and investments pay you?
3) If you never get round to a will, who inherits what, and in what proportion?
Most people manage one at best. Not because they're careless, but because nobody has shown them which order to tackle things in.
That order exists. Work through your finances in this sequence, from income and protection through to investments and estate planning.
Most Expensive HDB Flat
Singapore’s most expensive HDB resale flat was sold for a record $1,658,888. This 122-sqm premium loft apartment is located in Queenstown and has a remaining lease of 89 years.
Below are details of the most expensive HDB flats:
| Transaction Date | Resale Price | Town/Estate | Flat Type | Block | Street Name | Storey Range | Floor Area (sqm) | Flat Model | Lease Commencement Date | Remaining Lease |
|---|---|---|---|---|---|---|---|---|---|---|
| 2025-06 | $1,658,888 | QUEENSTOWN | 5 ROOM | 92 | DAWSON RD | 22 TO 24 | 122.00 | Premium Apartment Loft | 2016 | 89 years 11 months |
| 2025-11 | $1,632,000 | BISHAN | 5 ROOM | 275A | BISHAN ST 24 | 34 TO 36 | 120.00 | DBSS | 2011 | 84 years 10 months |
| 2025-11 | $1,600,000 | BISHAN | EXECUTIVE | 135 | BISHAN ST 12 | 22 TO 24 | 163.00 | Maisonette | 1987 | 60 years 08 months |
| 2025-08 | $1,600,000 | CENTRAL AREA | 5 ROOM | 1G | CANTONMENT RD | 49 TO 51 | 105.00 | Type S2 | 2011 | 84 years 05 months |
| 2025-01 | $1,600,000 | TOA PAYOH | 5 ROOM | 138A | LOR 1A TOA PAYOH | 19 TO 21 | 117.00 | DBSS | 2012 | 86 years 06 months |
As of December 2025, a total of 5 units were sold for $1.6 million or more.
Will we see records broken again? Only time will tell.
Locations of Million-Dollar HDB Flats
The top 5 areas with the most million-dollar transactions are Toa Payoh, Bukit Merah, Queenstown, Kallang/Whampoa, and Bishan.
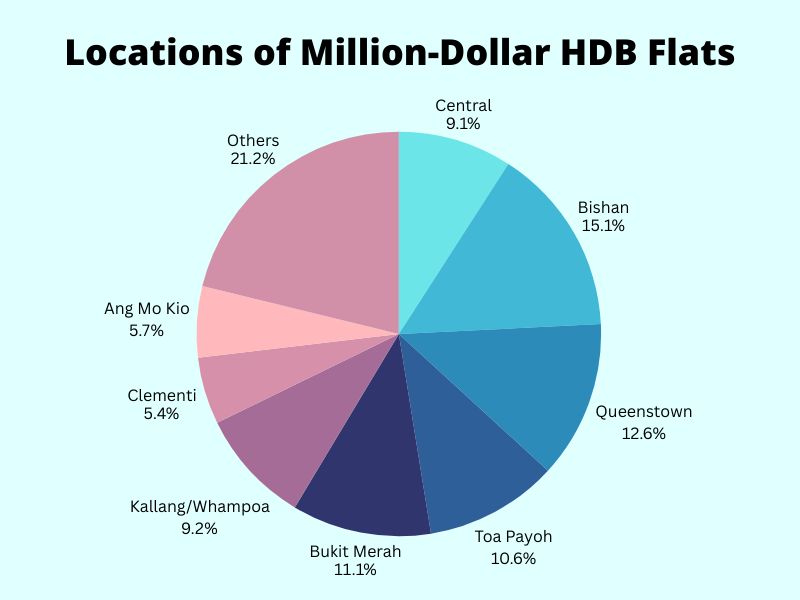
| HDB Town/Estate | Number of Million-Dollar HDB Flats |
|---|---|
| Central | 367 |
| Toa Payoh | 609 |
| Bukit Merah | 507 |
| Kallang/Whampoa | 429 |
| Queenstown | 449 |
| Bishan | 369 |
| Ang Mo Kio | 216 |
| Clementi | 229 |
| Others | 854 |
And here’s the breakdown from 2012 to 2025:
| HDB Town/Estate | 2025 | 2024 | 2023 | 2022 | 2021 | 2020 | 2019 | 2018 | 2017 | 2016 | 2015 | 2014 | 2013 | 2012 | Total |
|---|---|---|---|---|---|---|---|---|---|---|---|---|---|---|---|
| Ang Mo Kio | 81 | 67 | 31 | 30 | 5 | 2 | 216 | ||||||||
| Bedok | 39 | 25 | 9 | 3 | 76 | ||||||||||
| Bishan | 98 | 78 | 45 | 50 | 37 | 14 | 11 | 12 | 17 | 2 | 1 | 2 | 1 | 1 | 369 |
| Bukit Batok | 8 | 3 | 4 | 1 | 16 | ||||||||||
| Bukit Merah | 216 | 135 | 62 | 45 | 24 | 13 | 5 | 7 | 507 | ||||||
| Bukit Panjang | 11 | 9 | 1 | 21 | |||||||||||
| Bukit Timah | 23 | 24 | 14 | 10 | 13 | 3 | 3 | 2 | 1 | 1 | 94 | ||||
| Central | 55 | 47 | 48 | 50 | 75 | 22 | 22 | 18 | 10 | 11 | 9 | 367 | |||
| Chua Chu Kang | – | ||||||||||||||
| Clementi | 106 | 52 | 31 | 21 | 10 | 4 | 1 | 1 | 2 | 1 | 229 | ||||
| Geylang | 62 | 50 | 11 | 7 | 1 | 131 | |||||||||
| Hougang | 45 | 31 | 5 | 5 | 1 | 87 | |||||||||
| Jurong East | 16 | 6 | 6 | 1 | 29 | ||||||||||
| Jurong West | – | ||||||||||||||
| Kallang/ Whampoa | 147 | 156 | 54 | 26 | 19 | 3 | 5 | 8 | 3 | 6 | 1 | 1 | 429 | ||
| Marine Parade | 15 | 5 | 5 | 3 | 28 | ||||||||||
| Pasir Ris | 20 | 5 | 2 | 2 | 29 | ||||||||||
| Punggol | 4 | 3 | 2 | 1 | 10 | ||||||||||
| Queenstown | 173 | 109 | 48 | 38 | 38 | 16 | 9 | 12 | 5 | 1 | 449 | ||||
| Sembawang | – | ||||||||||||||
| Sengkang | 11 | 4 | 15 | ||||||||||||
| Serangoon | 50 | 29 | 15 | 15 | 7 | 1 | 117 | ||||||||
| Tampines | 68 | 22 | 2 | 2 | 94 | ||||||||||
| Tengah | – | ||||||||||||||
| Toa Payoh | 302 | 144 | 57 | 45 | 31 | 7 | 8 | 9 | 6 | 609 | |||||
| Woodlands | 29 | 22 | 14 | 9 | 74 | ||||||||||
| Yishun | 15 | 9 | 4 | 5 | 33 | ||||||||||
| Total | 1,594 | 1,035 | 470 | 369 | 259 | 82 | 64 | 71 | 46 | 20 | 12 | 2 | 3 | 2 | 4,029 |
In Singapore, there are a total of 27 housing towns and estates, as outlined by HDB. All except 4 towns have already seen million-dollar transactions. Those 4 towns are Chua Chu Kang, Jurong West, Sembawang, and Tengah.
With the rising cost of living and property prices, perhaps we could see those towns having their firsts in the next few years.
Flat Types of HDB Flats Sold for $1 Million or More
Most transactions were for 5-room flats, followed by executive, and 4-room.
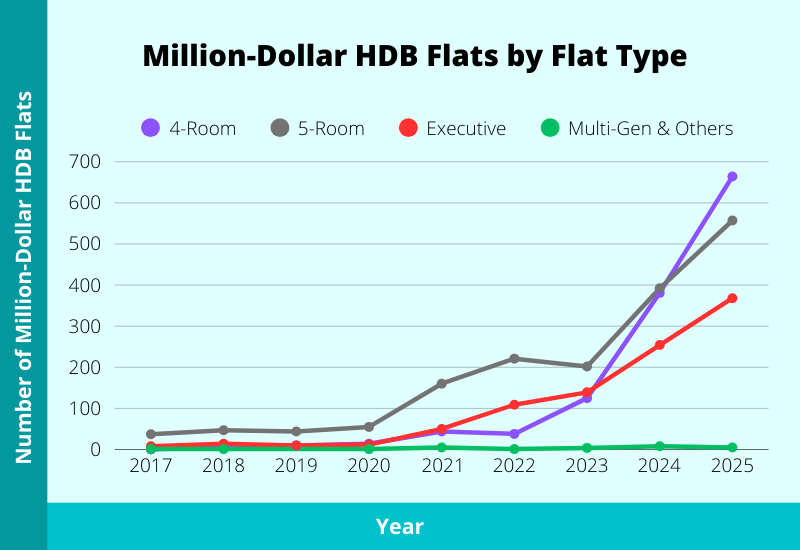
| Type of Flats | 2025 | 2024 | 2023 | 2022 | 2021 | 2020 | 2019 | 2018 | 2017 |
|---|---|---|---|---|---|---|---|---|---|
| 4-Room | 664 | 381 | 125 | 38 | 44 | 14 | 10 | 9 | 0 |
| 5-Room | 557 | 392 | 202 | 221 | 160 | 55 | 44 | 47 | 37 |
| Executive | 368 | 254 | 139 | 109 | 50 | 12 | 10 | 14 | 8 |
| Multi-Gen | 3 | 4 | 1 | 1 | 0 | 0 | 0 | 0 | 0 |
| Others (Terrace) | 2 | 4 | 3 | 0 | 5 | 1 | 0 | 1 | 1 |
Generally, all types of flats are trending upwards.
It is noteworthy that the first transaction for 4-room million-dollar flats was in 2018, and since then, the number of transactions has been growing. If smaller-sized flats are commanding such a high price, it can be a sign of concern.
When even 4-room flats cross the million-dollar mark, the stakes of planning your property decisions properly are higher than ever.
Qualities of a Million-Dollar HDB Flat
What makes a million-dollar flat? Here are 3 main qualities:
- Location – Location, location, location. Flats closer to the central area tend to command higher prices. Other factors include being in mature estates and close to significant amenities, such as MRTs or town centres.
- Size – As Singapore lacks land and space, bigger-sized homes are pricier. The rarity of these flats also matters. Jumbo flats or lofts tend to be costly not only because of their larger space, but they are also in limited quantities.
- Lease – People usually pay more for flats with longer leases remaining. The high-priced flats in Pinnacle@Duxton not only just came out of their 5-year MOP (Minimum Occupation Period), they were in the central area. The exception to this point is that older flats have shorter remaining leases but tend to have bigger spaces. The other exception is simply a good location.
What’s Next?
The rise in property prices in Singapore is simply due to supply and demand.
Government policies, such as compulsory CPF contributions, BTOs, and grants, enabled Singaporeans to purchase homes comfortably. In addition, median household incomes rose significantly over the years. But the amount of properties available still remains limited.
The government has since tweaked its policies to prevent an overheated property market, especially in public housing. This will continue to be an extremely important and delicate issue as it has considerable social and economic impacts on youths in Singapore.
Higher-priced homes also mean larger liabilities (mortgage loans). For your family to continue to have a roof over their heads, consider protecting your income through term insurance or mortgage insurance (personal plans or HPS). They ensure that mortgage loans can be fully paid for if undesirables, such as death, permanent disabilities, or critical illnesses, happen.
Methodology
We only looked at the most reliable data available and that comes from HDB. It includes comprehensive data on HDB resale flats, dating back to 1990. The dataset looks at several fields, namely, registration date, town, flat type, block number, storey range, floor area, flat model, lease commencement date, remaining lease, and the resale price. Although the data is updated daily, we’ll only update this report after the end of a quarter.
BEFORE YOU GO
Articles can tell you what generally makes sense. They can't see your policies, your CPF, or your plans.
FullCircle is our comprehensive financial planning session. A licensed consultant goes through what you have, shows you the gaps and overlaps, and tells you what to prioritise across protection, retirement, and estate planning.
It's complimentary, takes about 45 minutes, and if nothing needs changing, we'll say so.