With a higher income, you can create, retain, and protect wealth more quickly, especially if you use the right tools and practise proper financial planning.
Despite its small size, Singapore already boasts 332,491 millionaires. The mean and median net worth per adult in Singapore are $516,991 and $134,308, respectively.
Does this mean that Singaporeans are earning a high income? What about the average man on the street? Is there income (and wealth) inequality here?
We aimed to determine the median income or salary in Singapore. And we further break it down by age, sex, education, occupation, and industry. If you want to check out statistics on household income instead, click here.
So, if you wish to compare your income with others and see whether it’s good enough, then you should read on!
All figures are in Singapore dollars unless specified otherwise; an exchange rate of US$1 to S$1.30 was applied for conversions.
Summary of Key Findings
- The median income (inclusive of employer CPF contributions) in Singapore is $5,775/month ($69,300/year). This equates to US$4,442/month or US$53,304/year.
- Without employer CPF contributions, the median income is $5,000/month or $60,000/year.
- Singapore’s median income has grown 46.2% over the past 10 years, an annualised increase of 3.9%.
- Salaries are likely to peak between the ages of 40 and 44.
- In general, males earn more than females. In 2025, the median salary for men was 9.9% (or $540) higher than that of women.
- Degree holders earn a median income of $9,038, which is $3,968 (or 78.3%) more than diploma holders.
- Over the past 10 years, the industry that held the highest median salary was financial and insurance services. In 2025, this industry had a median salary of $9,258.
Read on for more details.
SIDE NOTE
A policy bought years ago. Savings in three places. A will that's still on the to-do list.
None of it is wrong. It's just not a plan yet.
There's an order that turns the pieces into one system, and it doesn't require becoming a finance expert. Here's the order, in 7 steps, so you know what to sort out first.
The Source of Our Data
We relied on the most reliable data available, sourced from the Ministry of Manpower.
The Manpower Research & Statistics Department publishes comprehensive employment reports annually. As of 5 February 2026, the latest data was released on 29 January 2026.
For this article, we’re focusing on gross monthly income from work. This includes full-time employees and self-employed persons who are Singapore citizens or permanent residents (PRs).
For employees, gross monthly income refers to monthly salaries or wages, including basic wages, overtime pay, commissions, other allowances, and one-twelfth of annual bonuses. It is measured before the deduction of employee CPF contributions and income tax and generally includes employer or platform operator CPF contributions, unless otherwise stated.
For self-employed persons, it refers to average monthly profits from their business, trade, or profession before income tax.
Although “income” and “salary” have distinctions, we’ll use them interchangeably for clarity.
The Difference Between Averages: Mean vs Median
The most popular measurements of average are mean and median.
For example, we have this set of data:
| Person 1 | $3,000 |
| Person 2 | $4,000 |
| Person 3 | $5,000 |
| Person 4 | $6,000 |
| Person 5 | $17,000 |
To get the mean, you’ll need to sum up all the figures (3,000+4,000+5,000+6,000+17,000) and divide the sum by five, and the answer will be $7,000.
To get the median, you’ll just have to arrange the figures from smallest to largest. The one at the very middle (or 50th percentile) is the median, and that’s $5,000. If there are two numbers in the middle, then you’ll sum up both the numbers and divide it by two.
For determining average income/salary, median is preferable. It would mean that 50% of the population is below that median figure, and the other 50% is above it.
Average Income/Salary in Singapore (in General)
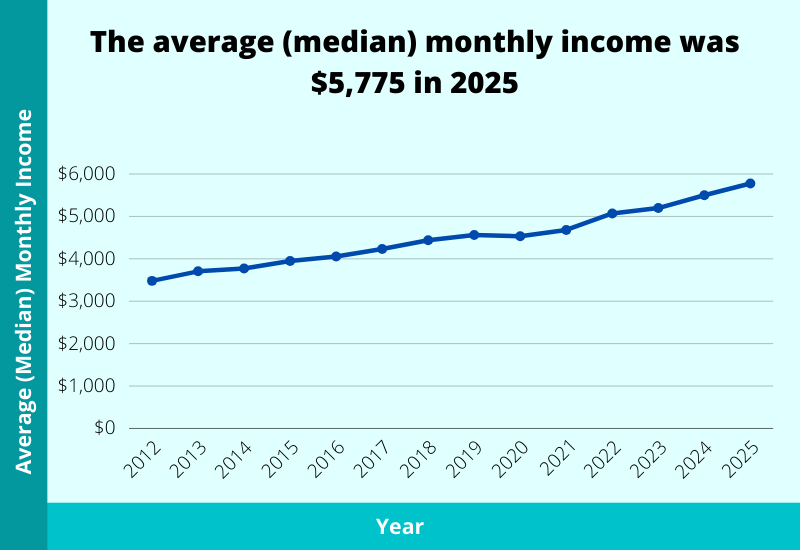
What is the median salary in Singapore? The median monthly salary in 2025 was $5,775 ($69,300/year). This equates to US$4,442/month or US$53,304/year.
Here are the income figures for the past 10 years:
| Year | Median Monthly Income (Including Employer CPF Contributions) |
|---|---|
| 2012 | $3,480 |
| 2013 | $3,705 |
| 2014 | $3,770 |
| 2015 | $3,949 |
| 2016 | $4,056 |
| 2017 | $4,232 |
| 2018 | $4,437 |
| 2019 | $4,563 |
| 2020 | $4,534 |
| 2021 | $4,680 |
| 2022 | $5,070 |
| 2023 | $5,197 |
| 2024 | $5,500 |
| 2025 | $5,775 |
From 2024 to 2025, the median monthly income increased from $5,500 to $5,775, reflecting an increase of 5.0%.
Over the past 10 years (2015 to 2025), Singapore’s median income increased by 46.2%. This is an annualised increase of 3.9%. After factoring in inflation, the annual increase was 2.1%.
If we exclude employer CPF contributions, the median income in 2025 was $5,000 per month (or $60,000 per year).
Average Income/Salary in Singapore (By Age)
Typically, our wages rise as we age (up to a certain point). This is because of many factors, such as experience, pay increments, and promotions.
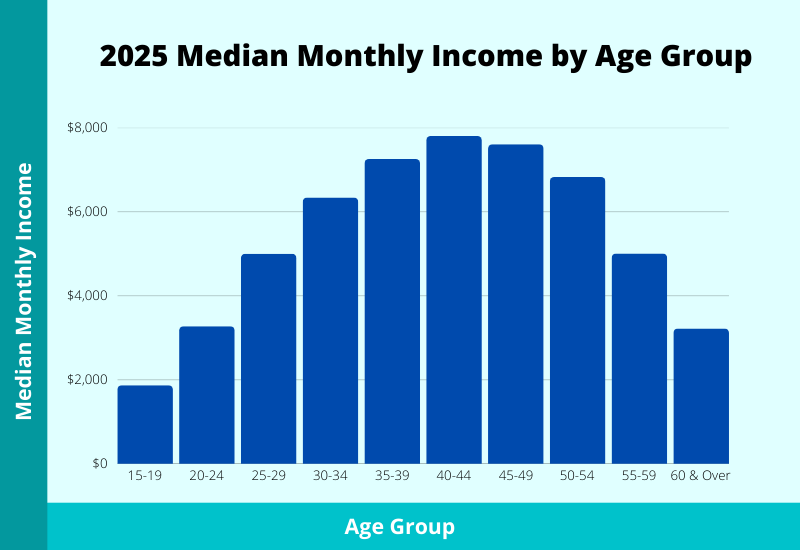
Here are the median salaries by age group:
| Age Group | 2025 Median Monthly Salary (Including Employer CPF Contributions) | 2024 Median Monthly Salary (Including Employer CPF Contributions) | 2023 Median Monthly Salary (Including Employer CPF Contributions) | 2022 Median Monthly Salary (Including Employer CPF Contributions) | 2021 Median Monthly Salary (Including Employer CPF Contributions) |
|---|---|---|---|---|---|
| 15 – 19 | $1,872 | $1,170 | $1,580 | $1,638 | $1,170 |
| 20 – 24 | $3,276 | $3,269 | $3,042 | $2,925 | $2,691 |
| 25 – 29 | $5,000 | $4,680 | $4,680 | $4,446 | $4,095 |
| 30 – 34 | $6,338 | $5,870 | $5,850 | $5,792 | $5,222 |
| 35 – 39 | $7,253 | $7,049 | $6,718 | $6,825 | $6,102 |
| 40 – 44 | $7,800 | $7,434 | $7,098 | $6,825 | $6,825 |
| 45 – 49 | $7,605 | $7,498 | $6,825 | $6,581 | $5,958 |
| 50 – 54 | $6,825 | $6,400 | $5,850 | $5,850 | $5,070 |
| 55 – 59 | $5,005 | $4,731 | $4,351 | $4,323 | $3,729 |
| 60 & Over | $3,222 | $3,052 | $2,905 | $2,621 | $2,543 |
From the table (for 2025), we can see that the median salary is lowest at $1,872 in the 15–19 age group. It then rises, peaking at $7,800 between ages 40–44, before gradually declining until the typical retirement age of 60 and over, where it falls to $3,222.
What insights can we draw from this?
It’s natural that earnings decline as you approach retirement. This highlights the importance of saving early. If you’re young, setting aside money for the future — especially for retirement — is crucial. Delaying this could make it harder to reach your retirement goals.
QUICK CHECK
Can you answer these three questions?
1) If something happened to you tomorrow, how much would your family receive?
2) At 65, what monthly income will your savings and investments pay you?
3) If you never get round to a will, who inherits what, and in what proportion?
Most people manage one at best. Not because they're careless, but because nobody has shown them which order to tackle things in.
That order exists. Work through your finances in this sequence, from income and protection through to investments and estate planning.
Average Income/Salary in Singapore (By Sex)
The gender pay gap has always been a hot topic in Singapore (and in any developed country).
Are males earning more than females?
Here are the median incomes for both males and females for the past 10 years:

| Year | Males’ Median Monthly Income (Including Employer CPF Contributions) | Females’ Median Monthly Income (Including Employer CPF Contributions) | Is the median income higher for males than females? | What’s the difference in absolute dollars? | What’s the difference in percentage? |
|---|---|---|---|---|---|
| 2012 | $3,640 | $3,230 | Yes | $410 | 12.7% |
| 2013 | $3,915 | $3,480 | Yes | $435 | 12.5% |
| 2014 | $4,000 | $3,518 | Yes | $482 | 13.7% |
| 2015 | $4,118 | $3,744 | Yes | $374 | 10.0% |
| 2016 | $4,241 | $3,803 | Yes | $438 | 11.5% |
| 2017 | $4,437 | $4,027 | Yes | $410 | 10.2% |
| 2018 | $4,680 | $4,095 | Yes | $585 | 14.3% |
| 2019 | $4,810 | $4,329 | Yes | $481 | 11.1% |
| 2020 | $4,719 | $4,374 | Yes | $345 | 7.9% |
| 2021 | $4,875 | $4,437 | Yes | $438 | 9.9% |
| 2022 | $5,450 | $4,948 | Yes | $502 | 10.1% |
| 2023 | $5,460 | $5,070 | Yes | $390 | 7.7% |
| 2024 | $5,850 | $5,265 | Yes | $585 | 11.1% |
| 2025 | $6,000 | $5,460 | Yes | $540 | 9.9% |
In 2025, men’s median salary was 9.9% (or $540) higher than women’s. This gap was smaller than in 2024, when men earned 11.1% more (or $585) than women.
Looking at the broader trend, the gender pay gap appears to be narrowing. Since 2012, the percentage difference in salaries had consistently been in double digits, only dropping to single digits in 2020 and 2021. The 7.7% gap in 2023 was the lowest recorded. While the gap widened in 2024, this does not necessarily indicate a reversal of the trend.
For further insight, here are the median salaries broken down by age and gender:
| Age Group | 2025 Males’ Median Monthly Salary (Including Employer CPF Contributions) | 2025 Females’ Median Monthly Salary (Including Employer CPF Contributions) |
|---|---|---|
| 15 – 19 | $1,872 | $1,919 |
| 20 – 24 | $3,000 | $3,452 |
| 25 – 29 | $4,680 | $5,070 |
| 30 – 34 | $6,338 | $6,235 |
| 35 – 39 | $7,859 | $6,825 |
| 40 – 44 | $8,580 | $7,020 |
| 45 – 49 | $8,532 | $6,928 |
| 50 – 54 | $7,508 | $6,084 |
| 55 – 59 | $5,544 | $4,547 |
| 60 & Over | $3,358 | $2,940 |
Females outearn males in the younger age brackets (15–29). It is only from age 30 onwards that men begin to earn more than women.
There are a few possible explanations for this. Firstly, males in Singapore undergo two years of full-time National Service, followed by a 10-year reservist cycle, which may impact their early career progression. Secondly, by age 30, many women reach the typical childbearing age. Some mothers may choose to prioritise caregiving responsibilities and opt for lower-intensity jobs or career breaks, affecting long-term earnings.
Average Income/Salary in Singapore (By Education)
In Singapore, there has always been a greater emphasis on the education system to gain a better financial standing (income and wealth), especially in the earlier years of its independence.
Today, this is still prevalent. Parents still want their children to achieve good grades, enter a reputable school, and eventually obtain at least a degree.
But does having a degree matter in today’s context?
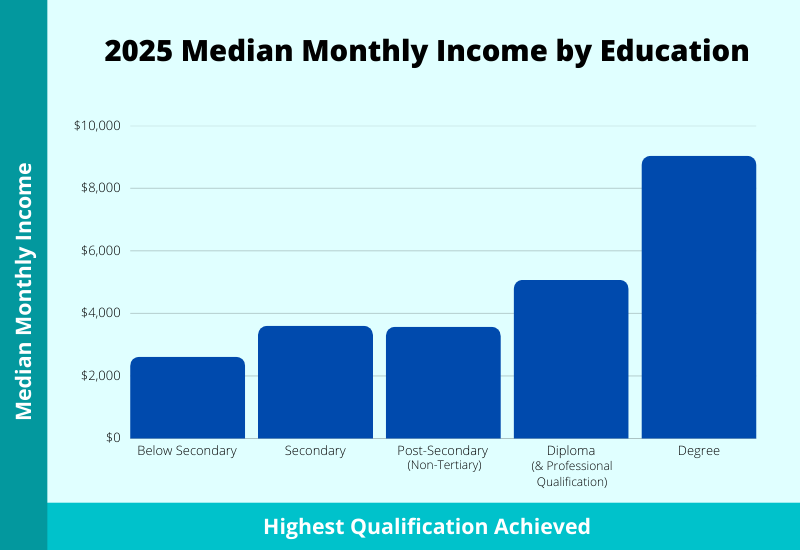
Here are the median salaries according to the highest qualifications achieved:
| Highest Qualification | 2025 Median Monthly Income (Including Employer CPF Contributions) |
|---|---|
| Below Secondary | $2,616 |
| Secondary | $3,606 |
| Post-Secondary (Non-Tertiary) | $3,574 |
| Diploma & Professional Qualification | $5,070 |
| Degree | $9,038 |
When we look at those numbers and nothing else, we can conclude that education still has a big part to play in terms of how much one can typically earn. The more educated you are, the higher your wages will be. Consequently, the demand for education has remained consistently high over the years, which has naturally led to the cost of education becoming significantly higher as well.
Degree holders still command the highest pay at $9,038. They earn $3,968 (or 78.3%) more than the second-highest group, which consists of diploma and professional qualification holders.
However, whether education will remain a determinant of income remains to be seen.
Average Income/Salary in Singapore (By Occupation)
Below are the average salaries by occupation:
| Occupation | 2025 Median Monthly Salary (Including Employer CPF Contributions) |
|---|---|
| Managers & Administrators | $11,445 |
| Professionals | $8,758 |
| Associate Professionals & Technicians | $4,853 |
| Clerical Support Workers | $3,510 |
| Service & Sales Workers | $3,315 |
| Craftsmen & Related Trades Workers | $3,270 |
| Plant & Machine Operators & Assemblers | $2,993 |
| Cleaners, Labourers, & Related Workers | $2,239 |
In 2025, professionals, managers, executives, and technicians (PMETs) earned a median monthly salary substantially higher than non-PMETs.
The managers and administrators are the highest-earning group, with a median salary of $11,445. The lowest are the cleaners, labourers, and related workers, with a median salary of $2,239.
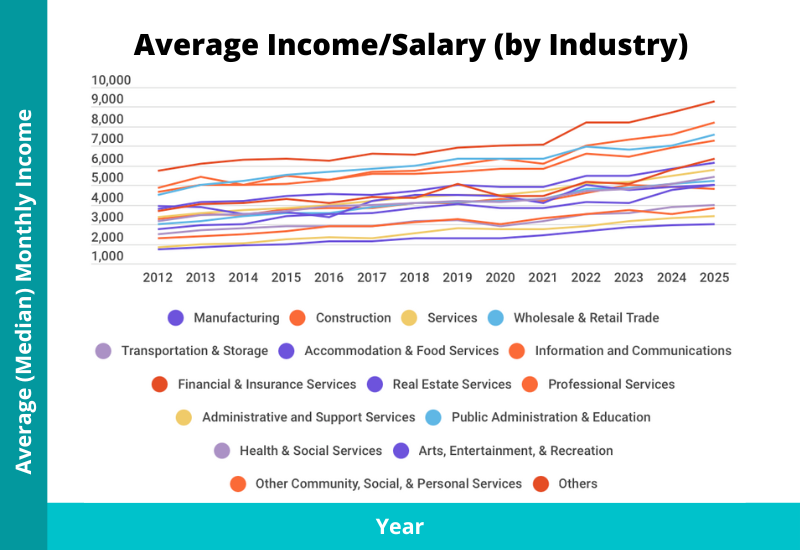
Average Income/Salary in Singapore (By Industry)
The COVID-19 pandemic has caused dramatic industry changes over a short period.
Some industries have recovered, while some will never, and then there are those that have performed exceedingly well.
Here are the average incomes by industry:
| Industry | 2025 | 2024 | 2023 | 2022 | 2021 | 2020 | 2019 | 2018 | 2017 | 2016 | 2015 | 2014 | 2013 | 2012 |
|---|---|---|---|---|---|---|---|---|---|---|---|---|---|---|
| Manufacturing | $6,131 | $5,850 | $5,460 | $5,460 | $4,896 | $4,885 | $5,000 | $4,680 | $4,500 | $4,571 | $4,437 | $4,210 | $4,162 | $3,770 |
| Construction | $4,820 | $4,914 | $5,000 | $4,583 | $4,200 | $4,294 | $4,095 | $4,095 | $3,803 | $3,803 | $3,790 | $3,480 | $3,518 | $3,263 |
| Services | $5,789 | $5,500 | $5,187 | $5,070 | $4,680 | $4,505 | $4,516 | $4,388 | $4,212 | $4,000 | $3,844 | $3,750 | $3,582 | $3,384 |
| – Wholesale & Retail Trade | $5,197 | $5,070 | $4,875 | $4,817 | $4,285 | $4,212 | $4,118 | $4,070 | $3,861 | $3,591 | $3,549 | $3,420 | $3,141 | $3,000 |
| – Transportation & Storage | $4,000 | $3,900 | $3,554 | $3,510 | $3,168 | $2,925 | $3,225 | $3,161 | $2,925 | $2,925 | $2,916 | $2,797 | $2,675 | $2,500 |
| – Accommodation & Food Services | $3,023 | $2,974 | $2,853 | $2,640 | $2,457 | $2,282 | $2,300 | $2,308 | $2,123 | $2,106 | $2,000 | $1,915 | $1,800 | $1,740 |
| – Information and Communications | $8,190 | $7,605 | $7,320 | $7,000 | $6,092 | $6,330 | $6,047 | $5,719 | $5,704 | $5,265 | $5,460 | $5,026 | $5,414 | $4,838 |
| – Financial & Insurance Services | $9,258 | $8,736 | $8,190 | $8,190 | $7,069 | $7,020 | $6,913 | $6,540 | $6,581 | $6,240 | $6,338 | $6,300 | $6,090 | $5,751 |
| – Real Estate Services | $5,000 | $4,908 | $4,777 | $5,000 | $4,095 | $4,437 | $4,520 | $4,475 | $4,183 | $3,390 | $3,611 | $3,500 | $3,857 | $3,915 |
| – Professional Services | $7,254 | $6,900 | $6,435 | $6,581 | $5,850 | $5,850 | $5,704 | $5,558 | $5,558 | $5,265 | $5,075 | $5,026 | $5,000 | $4,640 |
| – Administrative and Support Services | $3,397 | $3,296 | $3,168 | $2,925 | $2,725 | $2,748 | $2,808 | $2,535 | $2,311 | $2,362 | $2,238 | $2,036 | $1,972 | $1,799 |
| – Public Administration & Education | $7,605 | $7,032 | $6,833 | $6,962 | $6,338 | $6,338 | $6,338 | $6,012 | $5,850 | $5,655 | $5,538 | $5,220 | $5,000 | $4,495 |
| – Health & Social Services | $5,405 | $5,070 | $4,817 | $4,680 | $4,309 | $4,129 | $4,199 | $4,095 | $4,000 | $3,949 | $3,649 | $3,518 | $3,480 | $3,141 |
| – Arts, Entertainment, & Recreation | $5,005 | $4,777 | $4,095 | $4,150 | $3,803 | $3,803 | $4,056 | $3,803 | $3,549 | $3,510 | $3,422 | $2,997 | $2,978 | $2,736 |
| – Other Community, Social, & Personal Services | $3,803 | $3,510 | $3,721 | $3,510 | $3,296 | $2,996 | $3,250 | $3,089 | $2,925 | $2,925 | $2,662 | $2,514 | $2,395 | $2,289 |
| Others | $6,362 | $5,786 | $5,079 | $5,176 | $4,437 | $4,437 | $5,070 | $4,368 | $4,407 | $4,081 | $4,292 | $4,060 | $4,022 | $3,654 |
In 2025, the industry with the highest median income of $9,258 was financial and insurance services. The industry with the lowest of $3,023 was accommodation and food services.
Looking at the trend over the past 10 years, the financial and insurance services industry has always provided the highest median income, which is still growing. It is likely to perform well in the future, too, because of Singapore’s positioning to be a strong financial hub.
In Closing
Your income is one of the most, if not the most, important resources you have.
It allows you to pay your bills and financial commitments and to save for the future.
To increase your income, investing in your career is one of the surest things you can do. And when you have excess money, always make sure to make it work harder with investments. This is to ensure your hard-earned money doesn’t get eroded by inflation.
It’s essential to safeguard your future income and accumulated wealth with appropriate insurance policies, such as term or whole life insurance.
BEFORE YOU GO
Articles can tell you what generally makes sense. They can't see your policies, your CPF, or your plans.
FullCircle is our comprehensive financial planning session. A licensed consultant goes through what you have, shows you the gaps and overlaps, and tells you what to prioritise across protection, retirement, and estate planning.
It's complimentary, takes about 45 minutes, and if nothing needs changing, we'll say so.