

How much life insurance is enough? Most of us never really answer it, which is how we end up with a drawer of policies and no clear idea whether they add up. This page helps you put a number on it: use the calculator to find your shortfall across all four covers, then read on to see where the figures come from.
Key figures at a glance:
- Official guidance in Singapore suggests life cover of around 9 times your annual income for death and TPD, and 4 times for critical illness. There’s no official multiple for early CI, where we suggest 1 to 2 years.
- The average working adult here holds life cover of about 3.6 times annual income, and critical illness cover of about 2.1 times, according to the LIA Protection Gap Study 2022.
- That leaves an average mortality protection gap of S$170,352 and a critical illness gap of S$264,586 per economically active adult, as of 2022.
- SmartWealth’s own analysis found the average critical illness claim payout is just $52,343, nowhere near four years of most incomes.
SIDE NOTE
A policy bought years ago. Savings in three places. A will that's still on the to-do list.
None of it is wrong. It's just not a plan yet.
There's an order that turns the pieces into one system, and it doesn't require becoming a finance expert. Here's the order, in 7 steps, so you know what to sort out first.
How to Use This Life Insurance Calculator
The calculator estimates your shortfall for each of the four covers: death, total and permanent disability (TPD), critical illness (CI), and early critical illness (ECI). Here’s what to enter:
- Current monthly income. Your gross monthly income. Everything else is built on it, because insurance exists to replace the income your family loses when you can’t earn.
- Years of income for death and TPD. How long you’d want your income to continue for your family. Common choices: until your youngest child turns 21, or until your own retirement age. Nine years matches the official benchmark below.
- Years of income for CI. Five years is the usual planning figure, and the next section explains the logic behind it.
- Years of income for ECI. One to two years, enough to step away from work and focus on recovery.
- Existing cover for each type. Add up what you already hold, and don’t forget the cover you didn’t buy yourself: DPS and any riders on existing policies. There’s a full section on this below, and a policy summary makes the adding up much easier.
- Liquid assets. Savings or investments you’d genuinely be willing to spend if the worst happened. Most people enter 0, and that’s a perfectly sound choice.
How Much Life Insurance Do You Need in Singapore?
The benchmark answer: cover of around 9 times your annual income for death and TPD, and 4 times your annual income for critical illness. These multiples come from the MoneySense Basic Financial Planning Guide, which MAS, CPF Board, and MoneySense put together as a national rule of thumb, and they align with the Life Insurance Association’s research.
Here’s what that looks like in practice. Sarah is 35, married with a young son, and earns $6,000 a month, or $72,000 a year. The guideline suggests:
- Death and TPD cover: 9 x $72,000 = $648,000
- Critical illness cover: 4 x $72,000 = $288,000
Those numbers may look high, but remember what they’re replacing: nine years and four years of her entire income. And they’re gross targets. Sarah subtracts what she already has (her DPS), and the gap the calculator shows is what’s actually left to close.
It’s worth being clear about what these numbers are: baseline guidelines, the minimum most families should be aiming for, not a ceiling. Plenty of people decide they want more, and for good reason. A larger mortgage, private-school plans, an ageing parent to support, or simply the wish to leave more behind can all push the right figure well above the guideline. Others knowingly hold less. The multiple tells you the floor, not the answer.
A flat multiple also assumes an average family, and yours may not be one. That’s why the calculator asks for years of income instead: a 35-year-old with a newborn might want income flowing until the child turns 21, while a 55-year-old with working kids might need far less than nine years. Pick the horizon that matches your life, and let the multiple be your sense check.
How Much of Each Cover Do You Need?
Each cover answers a different question, so I’ll take them one at a time.
Death cover: who depends on your income
If you’re single with no dependants, death cover matters less, though a sum for your parents is a meaningful gesture for the years they supported you. Once you’re married or have children, it becomes the core of the plan: if you die, the payout is what carries the mortgage, the household bills, your kids’ education, and your family’s plans.
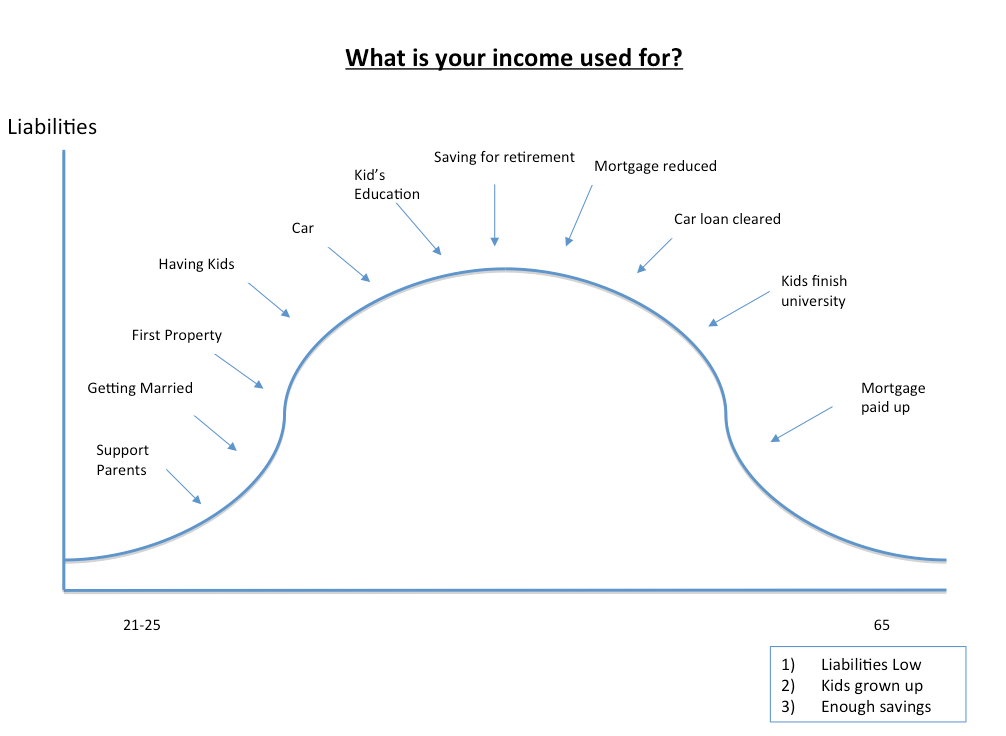
The years-of-income approach handles all of that in one decision. Cover the income, and you cover everything the income was going to pay for.
TPD cover: same size as death, expires earlier
TPD cover usually sits alongside death cover, and as a rider it can’t exceed your death sum assured. Standalone disability products work differently, but for most people the two move together.
Two things are worth knowing. TPD is typically the most affordable of the covers, because the probability of a claim is lower. And TPD riders generally expire around age 65 to 70, so it’s protection for your working years, which is precisely when losing your ability to earn does the most damage. Whether you’re single or not, TPD applies: if you can no longer work, someone still has to fund your care and your living costs.
Critical illness cover: four times income, and why five years
The official guideline is 4 times your annual income, and the reasoning is grounded in how serious illness actually plays out. Treatment and recovery typically take years, not months. Five years of partial income replacement is the common planning window: within it, most patients either recover and return to work, or the illness progresses and death cover takes over.
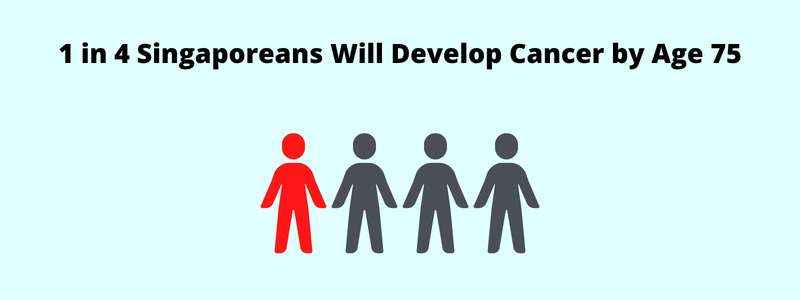
The odds are better than they used to be. The five-year survival rate for cancer in Singapore has reached 61.4% as of 2019 to 2023, up from 22.6% in the late 1970s. Surviving, though, is expensive: late-stage cancer treatment can run $100,000 to $200,000 a year, and that’s before you count the income that stops flowing during treatment. With the lifetime odds of developing cancer at roughly 1 in 4, CI cover is not the optional extra it’s sometimes made out to be.
One clarification, because the industry’s own jargon confuses people. The LIA framework standardises the definitions for 37 severe-stage critical illnesses, the major ones like cancer, heart attack, and stroke among them. Those shared definitions are the point: a severe-stage claim for any of the 37 means the same thing whichever insurer you’re with, so at this level you’re comparing plans on price and payout rather than on the fine print of the wording.
QUICK CHECK
Can you answer these three questions?
1) If something happened to you tomorrow, how much would your family receive?
2) At 65, what monthly income will your savings and investments pay you?
3) If you never get round to a will, who inherits what, and in what proportion?
Most people manage one at best. Not because they're careless, but because nobody has shown them which order to tackle things in.
That order exists. Work through your finances in this sequence, from income and protection through to investments and estate planning.
Early critical illness cover: one to two years, in my opinion
ECI plans pay out at the early and intermediate stages that standard CI plans don’t, and many allow multiple claims. That breadth makes ECI the most expensive cover of the four.
There’s no official multiple for ECI, which is worth saying plainly because nobody else does. In my opinion, one to two years of income is a sensible target: an early-stage diagnosis often still allows you to work, so the payout’s real job is buying you the option to stop working and recover properly instead of pushing through treatment. I’d treat ECI as the layer you add after death, TPD, and CI are settled, not before.
Don’t Forget the Cover You Already Have
Before you buy anything, subtract what’s already in place. The one most people forget is the Dependants’ Protection Scheme (DPS). If you’re a CPF member, you almost certainly have DPS: $70,000 of cover for death, terminal illness, or TPD up to age 60, then $55,000 until cover ends at 65. Premiums come out of your CPF, so it’s easy to forget it exists.
Singapore’s Protection Gap: Why Most People Are Underinsured
The gap between what we need and what we hold is measured, and it’s wide. The Life Insurance Association’s Protection Gap Study 2022 found the average economically active adult in Singapore has a mortality protection gap of S$170,352 and a critical illness protection gap of S$264,586. Across the whole workforce, 21% of mortality needs and 74% of critical illness needs simply aren’t covered.
If that 21% looks low against the 3.6 times income most people insure for, it’s because the study measures need and cover differently from the rule of thumb. Its definition of need works out to the same 9 times income, so insurance alone, at 3.6 times, meets only about 40% of it. The measured gap lands at 21% rather than 60% because the study also credits your CPF, savings, and investments towards the need, not your policies alone. That’s the more conservative reason to run the calculator with your assets set to 0: it holds your insurance to the full target on its own.
Our own research puts a sharper point on the CI side. SmartWealth’s analysis of 36 months of published insurer claims data found an average critical illness claim payout of $52,343. Against the four-times-income guideline, that’s less than a single year of income for many households. The full breakdown is in our study of average claim payouts.
That’s the point of running the calculator honestly. Most people who do find a shortfall. Knowing its size is what turns a vague worry into a decision.
Reading Your Results: From Shortfall to Plan
Shortfall = your calculated coverage − existing insurance − assets you’d use. A negative shortfall means a surplus. If it’s a large surplus on every line and the premiums are crowding out your saving and investing, you may be over-insured, and that’s worth a review of its own. A modest surplus, though, and you can stop reading with a clear conscience. For everyone else, three factors decide what to do next.
Adequate coverage. Picture the payout actually landing. Would it genuinely carry your family for the years you chose? If yes, the number is right, even if it looks large today.
Fits your budget. The same MoneySense guide suggests spending no more than 15% of your take-home pay on insurance protection. In my opinion, most families can close all four gaps well within that, provided the big sums go on term cover rather than whole life products. It’s also fine to close a gap partially and knowingly, as long as you understand the risk you’re keeping.
Right plan. Three product routes cover most situations:
Term insurance
Term plans deliver the largest cover per dollar, which makes them the natural tool for closing a big shortfall. There’s no cash value, and in exchange you get flexibility: adjust, replace, or drop the plan as life changes. Most term plans can carry death, TPD, and CI riders, and some add ECI. We’ve compared term life plans in detail if you want to see how they stack up.
Whole life insurance
Whole life plans combine protection with cash value, and modern versions add a multiplier that boosts your cover during your working years. The trade-off is cost: the same sum assured is substantially more expensive than term, so the cover amounts tend to be lower. Our whole life comparison covers the current options, and if you’re weighing the two approaches, we’ve set out the term versus whole life decision separately.
Early CI plans
Standalone early CI plans cover early, intermediate, and advanced stages, often with multiple claims. Their death and TPD components are negligible, so they complement rather than replace your core cover. Look here only after the basics are settled.
Whichever route fits, every application is subject to underwriting and health disclosure, so cover is easiest to secure while you’re healthy. And no plan is right for everyone. Your circumstances are what the calculator’s inputs are there to capture.
What’s Next
Once you know your shortfall, you know exactly what you’re solving for, and that alone puts you ahead of most people. To see where each cover fits in the bigger picture, from national schemes to buying order, our complete guide to insurance planning in Singapore walks through it step by step.
And if you’d rather have a professional run the numbers with you, across your policies, estate plan, and investments, our comprehensive financial planning session does exactly that, at no cost to you.
Methodology (Assumptions and Method)
No calculator should be a black box, so here’s ours in plain terms:
- For each cover type, your monthly income is multiplied by 12 and by the years of income you chose.
- Your existing cover for that type is subtracted.
- The liquid assets you entered are subtracted once across the board.
- What remains is your shortfall per cover type.
The tool applies no inflation adjustment and assumes no investment returns on a payout. Those simplifications pull in opposite directions: inflation erodes a payout’s value over time, while a sensibly invested lump sum earns returns, and for conservative planning the two roughly offset. Treat the outputs as planning estimates, and revisit them once a year or whenever your income or family situation changes.
BEFORE YOU GO
Articles can tell you what generally makes sense. They can't see your policies, your CPF, or your plans.
FullCircle is our comprehensive financial planning session. A licensed consultant goes through what you have, shows you the gaps and overlaps, and tells you what to prioritise across protection, retirement, and estate planning.
It's complimentary, takes about 45 minutes, and if nothing needs changing, we'll say so.