Death is the one certainty every financial plan is built around, yet it is the topic most of us plan for least.
The numbers below tell you how many people die in Singapore, what they die of, and your odds of reaching 65, 85, and even 100. Each one carries a practical lesson for you and your loved ones.
Let’s get into the data.
Top Death Statistics in Singapore (2026)
All figures below are from official Singapore data (SingStat, MOH, and the ICA), based on the latest 2024 and 2025 releases, except the claims figures, which come from SmartWealth’s own study of life insurance claims, and the centenarian count, which is from a Straits Times report.
- There were 26,499 deaths in Singapore in 2025, about 73 deaths a day
- Cancer is the leading cause of death, accounting for 26.5% of all deaths in 2024
- The top three causes (cancer, pneumonia, and ischaemic heart diseases) made up 69.1% of all deaths in 2024
- 86.7% of deaths in 2024 were of people aged 60 and above
- The age-standardised death rate has fallen by about 42% since 2000
- The risk of dying within a year is at its lowest in childhood, at about 1 in 10,000
- About 1 in 2 men and 2 in 3 women aged 30 today will live to 85, based on our calculations from the 2025 life tables
- Life expectancy at birth reached 83.9 years in 2025, the highest ever recorded
- Singapore’s infant mortality rate of 2.0 per 1,000 live births is among the lowest in the world
SIDE NOTE
A policy bought years ago. Savings in three places. A will that's still on the to-do list.
None of it is wrong. It's just not a plan yet.
There's an order that turns the pieces into one system, and it doesn't require becoming a finance expert. Here's the order, in 7 steps, so you know what to sort out first.
How Many People Die in Singapore Every Year?
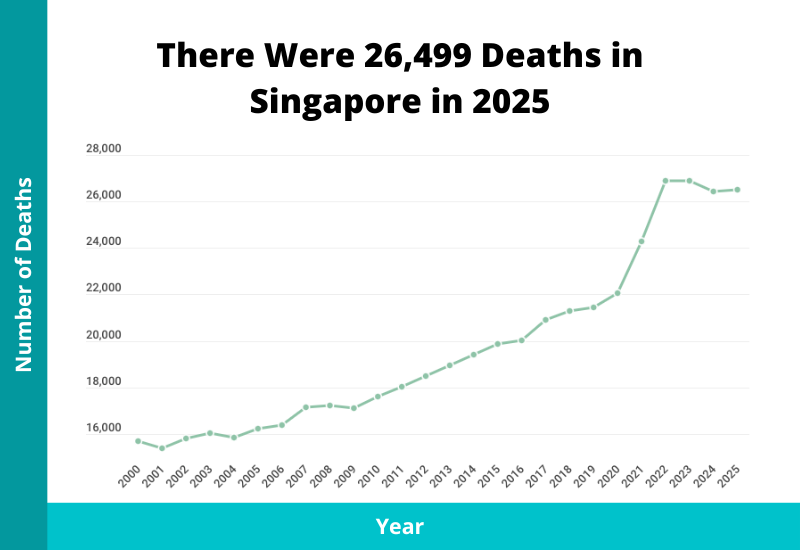
1) There were 26,499 deaths in Singapore in 2025
In 2025, there were 26,499 deaths registered in Singapore, based on data from the Singapore Department of Statistics. Of these, 25,300 were resident deaths (citizens and PRs).
That works out to about 73 deaths a day, or one death every 20 minutes.
| Year | Total Deaths |
|---|---|
| 2025 | 26,499 |
| 2024 | 26,442 |
| 2023 | 26,888 |
| 2022 | 26,891 |
| 2021 | 24,292 |
| 2020 | 22,054 |
| 2015 | 19,862 |
| 2010 | 17,610 |
| 2005 | 16,215 |
| 2000 | 15,693 |
The number of deaths has risen steadily, up nearly 70% since 2000. Deaths climbed more sharply in 2021 and 2022, partly reflecting pandemic-era mortality, before levelling off from 2023.
The longer-term rise doesn’t mean Singaporeans are becoming less healthy. It largely reflects an ageing population: when a bigger share of the population is elderly, more deaths occur in any given year.
2) The crude death rate is 6.0 per 1,000 residents
The crude death rate, the simplest measure of mortality, was 6.0 deaths per 1,000 residents in 2025. That compares with 4.5 in 2000.
Here’s how it has moved alongside the age-standardised death rate (more on that next):
| Year | Crude Death Rate (Per 1,000 Residents) | Age-Standardised Death Rate (Per 1,000 Residents) |
|---|---|---|
| 2025 | 6.0 | 5.1 |
| 2024 | 6.0 | 5.3 |
| 2023 | 6.2 | 5.6 |
| 2022 | 6.3 | 5.9 |
| 2021 | 5.8 | 5.6 |
| 2020 | 5.2 | 5.2 |
| 2015 | 4.8 | 5.8 |
| 2010 | 4.4 | 6.5 |
| 2005 | 4.4 | 7.6 |
| 2000 | 4.5 | 8.8 |
The crude death rate has drifted upwards because of the ageing population, not because health outcomes are worsening. A population with more elderly people will naturally record more deaths per 1,000 residents, everything else being constant.
3) The age-standardised death rate has fallen by about 42% since 2000
To see whether mortality is actually improving, we need the age-standardised death rate, which strips out the effect of the changing age structure. SingStat fixes the age structure to the resident population as at June 2020 to make the years comparable.
On that measure, the death rate fell from 8.8 per 1,000 residents in 2000 to 5.1 in 2025, a decline of about 42%.
In other words, at any given age, you are on average far less likely to die today than someone the same age 25 years ago. That likely reflects better healthcare, earlier detection of disease, and improved living standards.
One side effect worth knowing: falling mortality is a key reason term life insurance has become cheaper over the years. When people are less likely to die during the coverage period, insurers price policies lower.
What Are Your Chances of Reaching 65, 85, or 100?
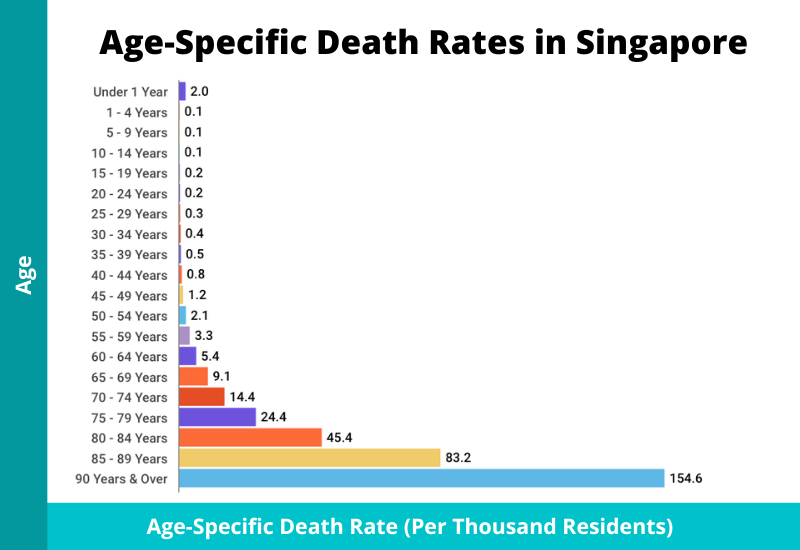
4) Your risk of dying within a year is lowest in childhood, at about 1 in 10,000
Before looking at your odds of reaching old age, it helps to know your risk of dying in any single year. That risk follows a J-shaped curve: slightly elevated in infancy, at its lowest in childhood, then climbing steadily for the rest of life.
The 2025 age-specific death rates show this clearly. The rate dips to 0.1 per 1,000 residents (about 1 in 10,000) from childhood through the early teens, is still only 0.4 per 1,000 in your early 30s, and passes 1 in 100 only from around age 70. From 90, it reaches about 15% in any given year.
| Age group | Deaths per 1,000 residents |
|---|---|
| Under 1 | 2.0 |
| 1-9 | 0.1 |
| 10-14 | 0.1 |
| 15-19 | 0.2 |
| 20-24 | 0.2 |
| 25-29 | 0.3 |
| 30-34 | 0.4 |
| 35-39 | 0.5 |
| 40-44 | 0.8 |
| 45-49 | 1.2 |
| 50-54 | 2.1 |
| 55-59 | 3.3 |
| 60-64 | 5.4 |
| 65-69 | 9.1 |
| 70-74 | 14.4 |
| 75-79 | 24.4 |
| 80-84 | 45.4 |
| 85-89 | 83.2 |
| 90 & over | 154.6 |
Notice how the rate more than doubles with each decade after 50. That compounding is exactly why the milestone odds in the next statistic look the way they do, and why insurers price cover so differently at 30 versus 60.
5) From age 30, about 1 in 2 men and 2 in 3 women will live to 85
A Singaporean man aged 30 has a 91.1% chance of reaching 65, a 47.9% chance of reaching 85, and a 2.3% chance of reaching 100. For a woman of the same age, the odds are higher across the board: 95.0%, 64.7%, and 5.2% respectively.
We computed these figures ourselves from the survivors column of the Complete Life Tables for the Singapore resident population.
| From age | Chance of reaching 65 | Chance of reaching 85 | Chance of reaching 100 |
|---|---|---|---|
| 30 (male) | 91.1% | 47.9% | 2.3% |
| 30 (female) | 95.0% | 64.7% | 5.2% |
| 40 (male) | 91.6% | 48.2% | 2.3% |
| 40 (female) | 95.3% | 64.9% | 5.2% |
| 50 (male) | 92.8% | 48.9% | 2.3% |
| 50 (female) | 96.1% | 65.5% | 5.3% |
One note on how to read these odds: they assume 2025 mortality rates hold for the rest of your life. Mortality has been falling for decades, so if that trend continues, your actual chances may be somewhat higher.
Three things stand out.
First, the odds barely move whether you start from 30, 40, or 50. Deaths before 50 are rare enough that getting a decade older hardly changes your outlook.
Second, the gap is small but it is not zero. Almost 1 in 10 men aged 30 will not see 65, and each of those deaths is one of the 73 that happen in Singapore every day, as we saw earlier. That gap is what life insurance exists for.
Third, these are the numbers that matter for planning. The chance of reaching 65 tells you how likely your working-life protection is to go unclaimed (good news you pay a small premium for). The chance of reaching 85 or beyond tells you how long your retirement savings may need to stretch.
What Are the Top Causes of Death in Singapore?
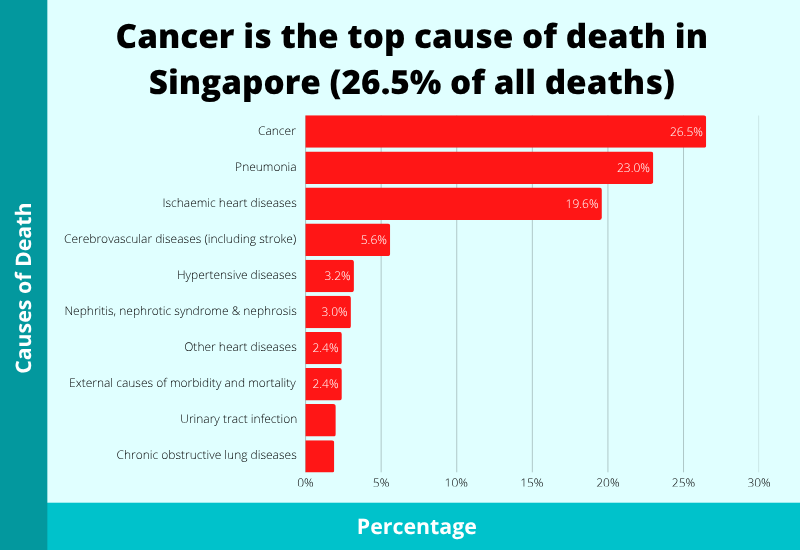
6) Cancer is the leading cause of death, at 26.5% of all deaths
Cancer caused 26.5% of all deaths in Singapore in 2024, making it the leading cause of death, according to the Ministry of Health’s principal causes of death data. Pneumonia (23.0%) and ischaemic heart diseases (19.6%) follow. Together, the top three account for 69.1% of all deaths.
Here are the top 10 causes in 2024:
| Cause | 2024 (% of Deaths) |
|---|---|
| Cancer | 26.5 |
| Pneumonia | 23.0 |
| Ischaemic heart diseases | 19.6 |
| Cerebrovascular diseases (including stroke) | 5.6 |
| Hypertensive diseases | 3.2 |
| Nephritis, nephrotic syndrome & nephrosis | 3.0 |
| Other heart diseases | 2.4 |
| External causes of morbidity and mortality | 2.4 |
| Urinary tract infection | 2.0 |
| Chronic obstructive lung diseases | 1.9 |
The top 10 causes together explain 89.6% of all deaths in 2024.
Two things in the table are worth a closer look.
First, cancer’s share jumped from 24.6% in 2023 to 26.5% in 2024, an unusually large move for a single year, though the 2024 figures are provisional and may be revised.
Second, pneumonia’s large share is not quite what it seems. In many of these deaths, pneumonia was the final event for someone already frail from advanced age or existing illness, rather than an infection that struck the healthy. The age breakdown in the next statistic shows this clearly.
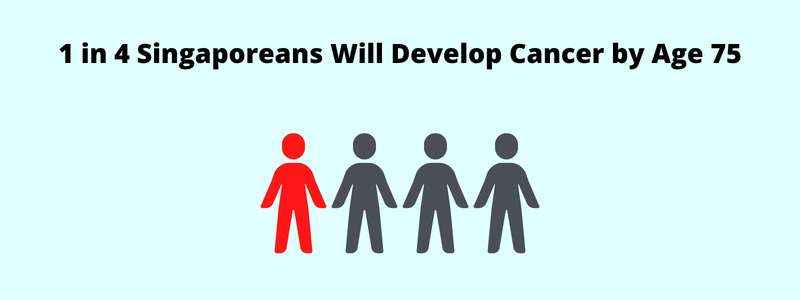
Cancer’s position at the top is no surprise given that 1 in 4 Singaporeans is expected to develop cancer in their lifetime.
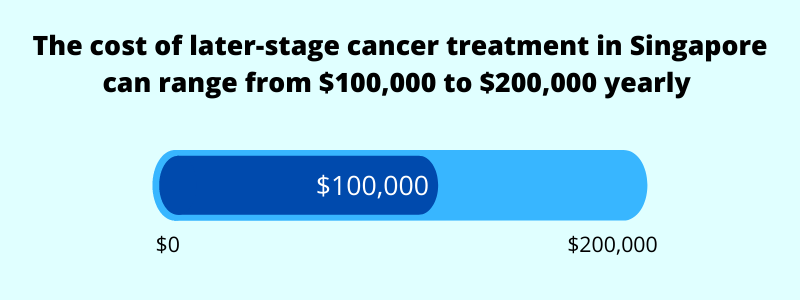
And the financial side is just as sobering: treating later-stage cancer can cost $100,000 to $200,000 a year.
7) The top causes of death change dramatically with age
Overall percentages hide the more useful story: what people die of depends heavily on how old they are. The ICA’s Report on Registration of Births and Deaths 2024 breaks deaths down by cause and age group, and the contrast is stark.
Most deaths happen late in life. 86.7% of deaths in 2024 were of people aged 60 and above. Those aged 50 to 59 accounted for another 6.9%.
In young adulthood, external causes dominate. Roughly 4 in 10 male deaths at ages 20 to 29 in 2024 were from external causes such as accidents and intentional self-harm. Illness barely features at these ages, so external causes dominate almost by default.
In midlife, disease takes over. From the 40s onwards, cancers and heart disease become the leading causes of death, which is why this is the decade where critical illness statistics start to matter for planning.
At the oldest ages, pneumonia is the biggest cause. Among men aged 90 and over who died in 2024, pneumonia accounted for roughly 4 in 10 deaths.
There are differences between the sexes too. Men died of ischaemic heart disease far more often than women, while cerebrovascular disease and kidney disorders made up a larger share of female deaths. Overall, roughly 1.2 men died for every woman in 2024, even though the elderly population itself skews female. Men simply die at higher rates at most ages.
QUICK CHECK
Can you answer these three questions?
1) If something happened to you tomorrow, how much would your family receive?
2) At 65, what monthly income will your savings and investments pay you?
3) If you never get round to a will, who inherits what, and in what proportion?
Most people manage one at best. Not because they're careless, but because nobody has shown them which order to tackle things in.
That order exists. Work through your finances in this sequence, from income and protection through to investments and estate planning.
8) Illness causes 97.6% of deaths, and external causes just 2.4%
For all the attention accidents receive, unnatural causes (accidents, suicides, and other external causes) made up only 2.4% of deaths registered in 2024, per the ICA report. The other 97.6% died of illness or natural causes.
That split matters for planning. Most deaths follow illness rather than accidents, and many come at the end of a long stretch of illness, often with heavy medical bills and time out of work beforehand. That is why death cover alone is incomplete protection: the illness that eventually causes a death can be a critical illness claim years earlier.
Life Expectancy in Singapore
9) Life expectancy at birth reached 83.9 years in 2025, the highest ever recorded
Singapore residents’ life expectancy at birth was 83.9 years in 2025, the highest since records began.
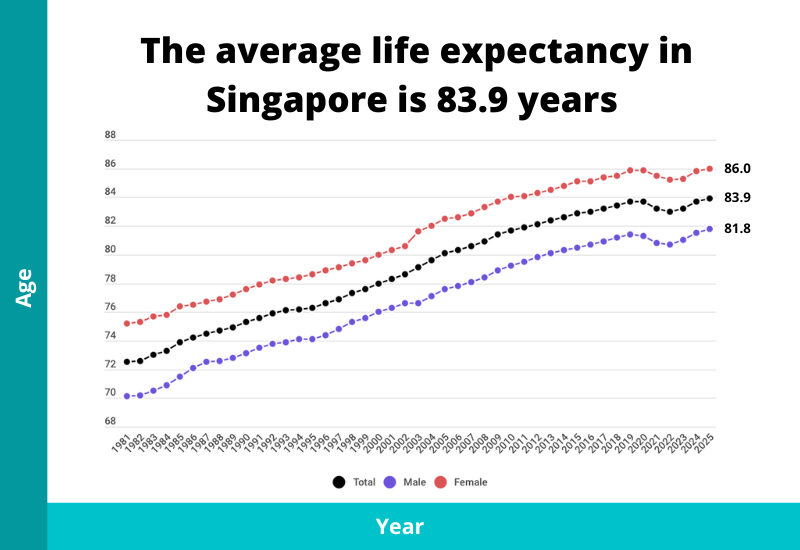
The figure comes from SingStat’s latest life tables, and finally surpasses the pre-pandemic peak of 83.7 years set in 2019, after the dips recorded during the pandemic years.
Men can expect 81.8 years and women 86.0 years. And if you have already made it to 65, the news is better still: residents aged 65 in 2025 can expect to live to 86.6 on average.
The point for planning is straightforward. The later years are the ones your savings have to cover, and a 65-year-old woman who plans only to 85 has a real chance of outliving her money. That is why life expectancy sits at the heart of retirement planning.
We cover the full trends, global rankings, and projections in our dedicated guide to life expectancy in Singapore.
Deaths at the Two Extremes of Age
10) Singapore’s infant mortality rate is among the lowest in the world
Singapore’s infant mortality rate was 2.0 deaths per 1,000 resident live births in 2025. In 1960, it was 34.9. That is a decline of over 94%, one of the biggest improvements in Singapore’s healthcare record.
| Year | Infant Mortality Rate (Per 1,000 Live Births) |
|---|---|
| 2025 | 2.0 |
| 2020 | 1.8 |
| 2010 | 2.0 |
| 2000 | 2.5 |
| 1990 | 6.6 |
| 1980 | 8.0 |
| 1970 | 20.5 |
| 1960 | 34.9 |
In absolute terms, there were just 79 infant deaths in 2024, based on the registration report. Singapore consistently ranks among the handful of countries with the lowest infant mortality worldwide.
11) Around 1,500 Singapore residents are aged 100 or older
There were around 1,500 residents aged 100 and over in Singapore in 2025, up from 1,200 in 2015, as reported by The Straits Times in February 2026.
This fits the survival odds we saw earlier. Living to a very old age is no longer the rare exception it once was, so it makes sense to plan for a retirement that could run 30 years or more, rather than treating that as a remote possibility.
What Death Claims Data Tells Us
Beyond the national statistics, our own study of life insurance claims in Singapore shows how death plays out in insurance terms.
12) Death claims make up 47.5% of life insurance claims
From the claims study, death claims accounted for 47.5% of life insurance claims, critical illness claims 49.7%, and total and permanent disability claims just 2.8%.
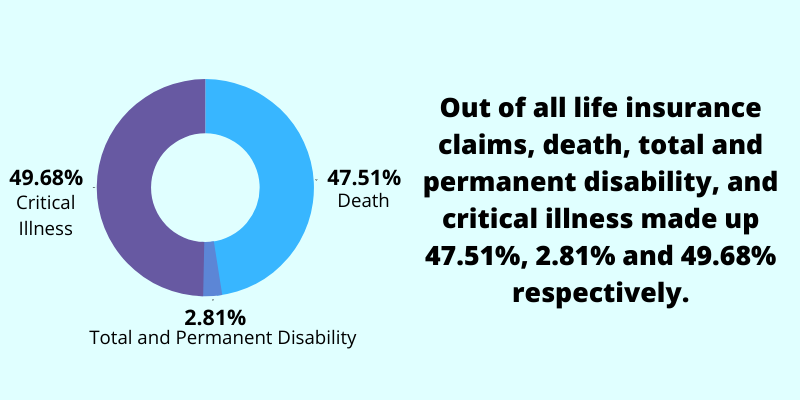
Notice that critical illness claims slightly outnumber death claims. That matches what the causes-of-death data told us earlier: illness, not sudden death, is the dominant risk through most of life.
13) Death claims peak between ages 61 and 65
Although the probability of dying keeps rising with age, death claims (among larger claims of $100,000 and above, where the study has age data) peak between 61 and 65, then fall away.
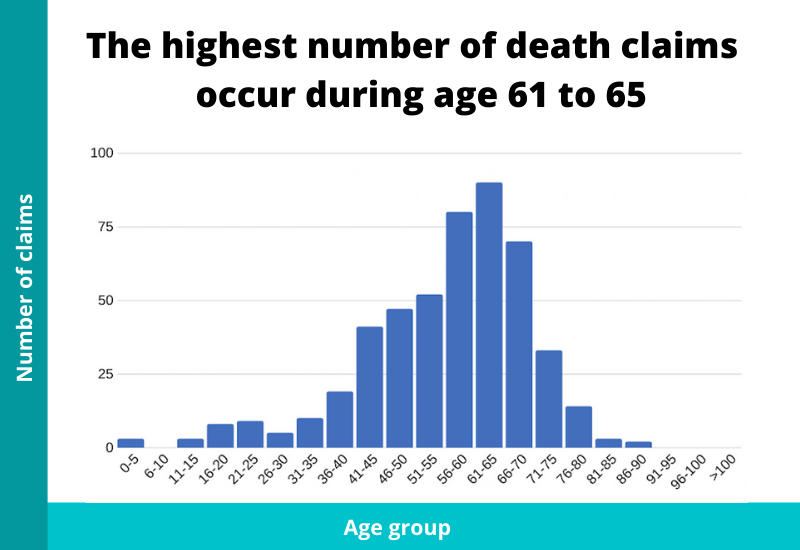
The likely explanation is that term policies had expired by the time of death, or that some whole life insurance policies were surrendered earlier for their cash value.
None of this is necessarily wrong. Life insurance primarily exists to replace lost income if you die prematurely, while others still depend on you. But it is worth checking that your cover doesn’t quietly run out before your obligations do, especially with a mortgage or dependants late into your 60s.
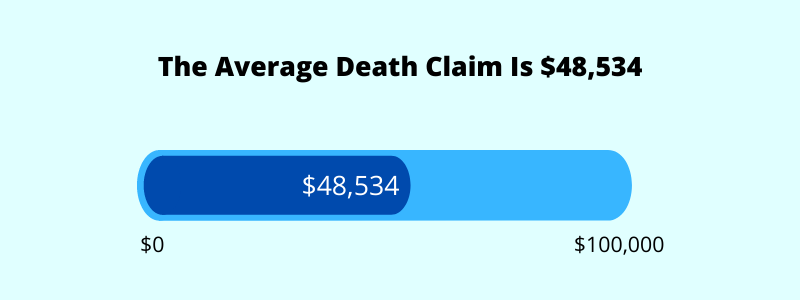
14) The average death claim in Singapore is $48,534
SmartWealth’s study of life insurance claims found that the average death claim payout in Singapore was $48,534.
Would that amount keep your family going? For many households it covers barely a year or two of expenses, let alone a mortgage and children’s education.
If death were to occur at a younger age, the shortfall between that payout and what your family actually needs could be severe. You can check your own number in a few minutes with our life insurance calculator.
Wrapping Up
Put together, the data tells a reassuring story with one caveat.
You will most likely die old: 86.7% of deaths happen after 60, life expectancy is at a record high, and mortality has kept falling for decades. But the odds are never zero at any age, and the deaths that happen young are precisely the ones families are least prepared for.
So plan in both directions. Protect your income for the years others depend on it, and prepare for the inevitable with the basics of estate planning, starting with writing a will. The statistics say you probably have decades left. Use a small part of that time to make things easier for the people you love.
BEFORE YOU GO
Articles can tell you what generally makes sense. They can't see your policies, your CPF, or your plans.
FullCircle is our comprehensive financial planning session. A licensed consultant goes through what you have, shows you the gaps and overlaps, and tells you what to prioritise across protection, retirement, and estate planning.
It's complimentary, takes about 45 minutes, and if nothing needs changing, we'll say so.