When planning your finances, understanding the average inflation rate is crucial for several reasons.
It helps you determine if your investment strategies are outpacing inflation and estimate the future costs of key goals, like retirement or your children’s university education.
But how much has the cost of living really increased over the years? And what’s the average inflation rate in Singapore?
Let’s take a closer look.
Read on to find out!
Summary of Key Findings
The yearly inflation rate in Singapore fluctuates over time.
For 2025 as a whole, the CPI All-Items (or headline/overall) inflation was 0.9%, while the MAS Core Inflation was 0.7%.
On a year-on-year basis in Jan 2026, headline inflation was 1.4%, while core inflation was 1.0%.
For 2026, MAS expects both headline and core inflation to be 1.0–2.0%.
Here are the average annual inflation rates in Singapore over the past years:
| Average Headline Inflation Rate (CPI All-Items) | Average Core Inflation Rate (MAS Core Inflation) | |
|---|---|---|
| Over the last 10 years (2015 to 2025) | 1.72% | 1.76% |
| Over the last 20 years (2005 to 2025) | 2.14% | 1.88% |
| Over the last 30 years (1995 to 2025) | 1.68% | 1.63% |
Read on further for more details.
SIDE NOTE
A policy bought years ago. Savings in three places. A will that's still on the to-do list.
None of it is wrong. It's just not a plan yet.
There's an order that turns the pieces into one system, and it doesn't require becoming a finance expert. Here's the order, in 7 steps, so you know what to sort out first.
What Is Inflation?
Inflation is the rise in the cost of goods and services over time.
While inflation happens most of the time in Singapore, negative inflation, or deflation, can happen too when the general level of prices fall.
According to the Monetary Authority of Singapore (MAS), low and stable inflation is thought to be a core component for long-term sustainable economic growth. The MAS also states that extreme rates of inflation, whether too high or too low, are unfavourable for the economy.
What Is the Consumer Price Index (CPI)?
A key indicator of inflation is the Consumer Price Index (CPI), which measures the change in prices over time of a fixed basket of goods and services typically consumed by resident households.
The CPI data are compiled by the Singapore Department of Statistics.
There are 10 main categories that are tracked:
- Food
- Transport
- Clothing & Footwear
- Communication
- Housing & Utilities
- Recreation & Culture
- Household Durables & Services
- Education
- Healthcare
- Miscellaneous Goods & Services
These categories are further broken down into subcategories.
This fixed basket that is used in the CPI tracks the prices of around 6,800 brands/varieties from 4,500 outlets. How are these prices collected? The data are obtained from various methods:
- Postal enquiries
- Email enquiries
- Electronic returns
- Web scraping data from relevant websites
- Administrative data
- Field interviewers
And because all goods and services are not equally important, a CPI weightage is applied.
2 Ways to Measure Inflation in Singapore
To measure the inflation of a specific area (e.g., cost of healthcare), you’d simply look at the CPI for that category.
Then, we’re able to get the rate of inflation for different categories such as education or healthcare.
However, in order to measure the “general” inflation, two main types of measures are used.
1) CPI All-Items (headline or overall inflation)
2) MAS Core Inflation (core inflation)
What’s the difference between headline inflation and core inflation?
Basically, the CPI All-Items factors in all 10 categories, and the MAS Core Inflation is the CPI All-Items excluding the components of “Accommodation” and “Private Transport”, which belong to the main categories of “Housing & Utilities” and “Transport”, respectively.
The reason why those two components are excluded from the MAS Core Inflation is because they go through short-term fluctuations and don’t form the everyday expenses of most households in Singapore.
In short, while both the headline and core inflation measures can diverge (move away) in the short run, they tend to converge (move together) in the long run.
We should always look at both measures as they tell different tales.
For example, what can we infer if the headline inflation rises by 1% while the core inflation increases by 8%?
If we look solely at the headline inflation, we may simply assume that the costs of goods and services aren’t rising that much. However, when we factor in the core inflation (which removes the influence of the bigger ticket items of accommodation and private transport), we can come to the conclusion that everyday expenses consumed by most households have increased significantly.
How to Calculate the Inflation Rate?
The inflation rate is the percentage increase (or decrease) in the general level of prices over a specified time, usually expressed yearly and sometimes monthly. It can also be expressed over a longer period of time (e.g., over 10 years from 2010 to 2020).
Here’s the formula to calculate the yearly inflation rate:
Inflation Rate = ((CPI of current year) – (CPI of previous year)) / (CPI of previous year) * 100
QUICK CHECK
Can you answer these three questions?
1) If something happened to you tomorrow, how much would your family receive?
2) At 65, what monthly income will your savings and investments pay you?
3) If you never get round to a will, who inherits what, and in what proportion?
Most people manage one at best. Not because they're careless, but because nobody has shown them which order to tackle things in.
That order exists. Work through your finances in this sequence, from income and protection through to investments and estate planning.
What’s the Current Inflation Rate in Singapore? (2026)
As the CPI All-Items (headline/overall) and MAS Core Inflation (core) are commonly used, here are the historical inflation rates for both of them (from 1990 to 2025).
CPI All-Items (headline/overall)
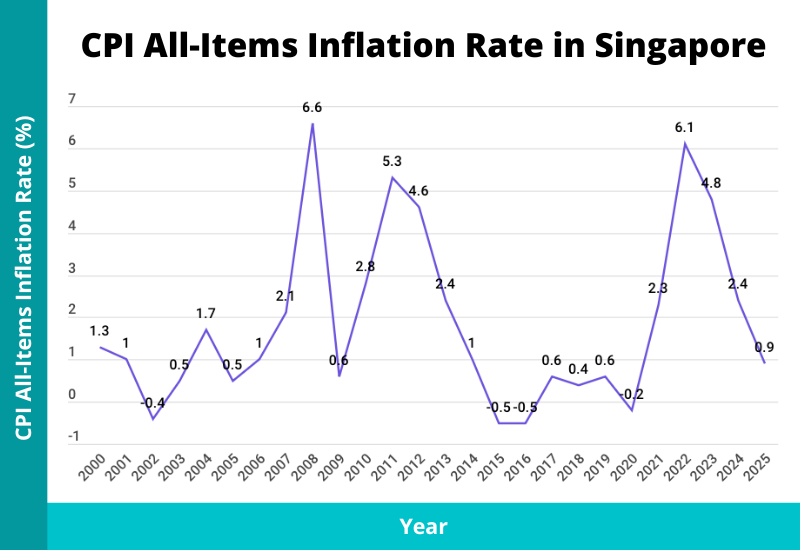
| 2025 | 2024 | 2023 | 2022 | 2021 | 2020 | 2019 | 2018 | 2017 | 2016 | 2015 | 2014 | 2013 | 2012 | 2011 | 2010 | 2009 | 2008 | 2007 | 2006 | 2005 | 2004 | 2003 | 2002 | 2001 | 2000 | 1999 | 1998 | 1997 | 1996 | 1995 | 1994 | 1993 | 1992 | 1991 | 1990 | |
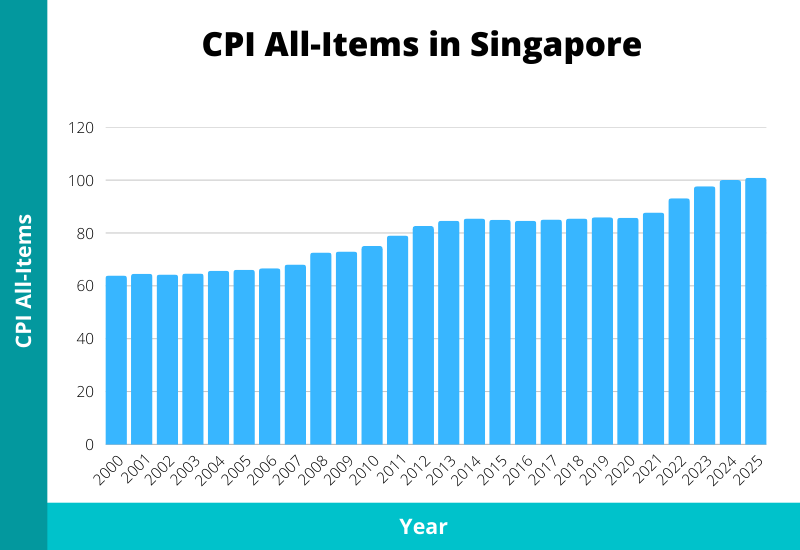
| CPI All-Items | 100.903 | 100 | 97.666 | 93.163 | 87.781 | 85.794 | 85.942 | 85.457 | 85.084 | 84.596 | 85.046 | 85.493 | 84.618 | 82.664 | 79.043 | 75.099 | 73.033 | 72.606 | 68.088 | 66.681 | 66.043 | 65.732 | 64.651 | 64.337 | 64.59 | 63.942 | 63.091 | 63.076 | 63.248 | 61.994 | 61.15 | 60.114 | 58.309 | 57.003 | 55.752 | 53.898 |
| Headline Inflation Rate (%) | 0.9 | 2.4 | 4.8 | 6.1 | 2.3 | -0.2 | 0.6 | 0.4 | 0.6 | -0.5 | -0.5 | 1 | 2.4 | 4.6 | 5.3 | 2.8 | 0.6 | 6.6 | 2.1 | 1 | 0.5 | 1.7 | 0.5 | -0.4 | 1 | 1.3 | 0 | -0.3 | 2 | 1.4 | 1.7 | 3.1 | 2.3 | 2.2 | 3.4 | 3.5 |
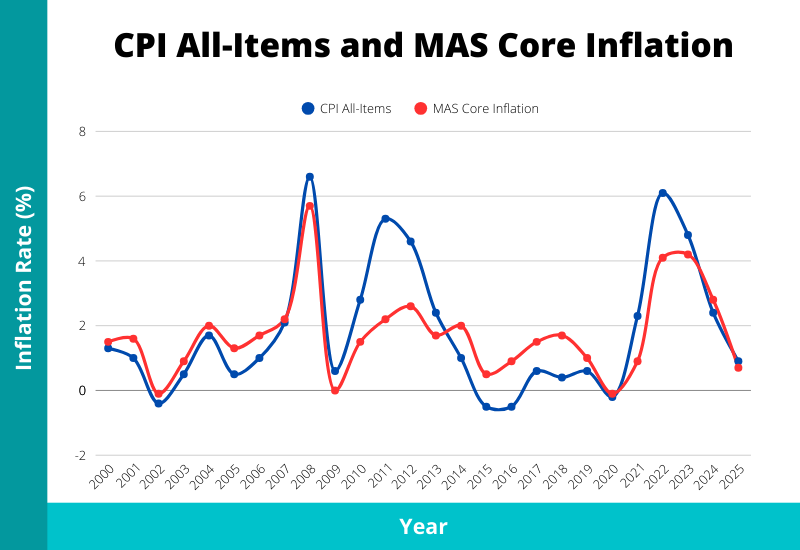
The headline inflation rate in 2025 was 0.9%. Over a period of 30 years from 1995 to 2025, the highest inflation in a year was 6.6% in 2008, while the lowest was -0.5% in 2015 and 2016. Since 2005 to 2025, the CPI All-Items has increased 52.8%.
Below, we look at headline inflation on a year-on-year basis (e.g., Dec 2021 vs Dec 2020).
| 2026 Jan | 2025 Dec | 2025 Nov | 2025 Oct | 2025 Sep | 2025 Aug | 2025 Jul | 2025 Jun | 2025 May | 2025 Apr | 2025 Mar | 2025 Feb | 2025 Jan | 2024 Dec | 2024 Nov | 2024 Oct | 2024 Sep | 2024 Aug | 2024 Jul | 2024 Jun | 2024 May | 2024 Apr | 2024 Mar | 2024 Feb | 2024 Jan | 2023 Dec | 2023 Nov | 2023 Oct | 2023 Sep | 2023 Aug | 2023 Jul | 2023 Jun | 2023 May | 2023 Apr | 2023 Mar | 2023 Feb | 2023 Jan | 2022 Dec | 2022 Nov | 2022 Oct | 2022 Sep | 2022 Aug | 2022 Jul | 2022 Jun | 2022 May | 2022 Apr | 2022 Mar | 2022 Feb | 2022 Jan | 2021 Dec | 2021 Nov | 2021 Oct | 2021 Sep | 2021 Aug | 2021 Jul | 2021 Jun | 2021 May | 2021 Apr | 2021 Mar | 2021 Feb | 2021 Jan | 2020 Dec | 2020 Nov | 2020 Oct | 2020 Sep | 2020 Aug | 2020 Jul | 2020 Jun | 2020 May | 2020 Apr | 2020 Mar | 2020 Feb | 2020 Jan | 2019 Dec | 2019 Nov | 2019 Oct | 2019 Sep | 2019 Aug | 2019 Jul | 2019 Jun | 2019 May | 2019 Apr | 2019 Mar | 2019 Feb | 2019 Jan | 2018 Dec | 2018 Nov | 2018 Oct | 2018 Sep | 2018 Aug | 2018 Jul | 2018 Jun | 2018 May | 2018 Apr | 2018 Mar | 2018 Feb | 2018 Jan | 2017 Dec | 2017 Nov | 2017 Oct | 2017 Sep | 2017 Aug | 2017 Jul | 2017 Jun | 2017 May | 2017 Apr | 2017 Mar | 2017 Feb | 2017 Jan | 2016 Dec | 2016 Nov | 2016 Oct | 2016 Sep | 2016 Aug | 2016 Jul | 2016 Jun | 2016 May | 2016 Apr | 2016 Mar | 2016 Feb | 2016 Jan | 2015 Dec | 2015 Nov | 2015 Oct | 2015 Sep | 2015 Aug | 2015 Jul | 2015 Jun | 2015 May | 2015 Apr | 2015 Mar | 2015 Feb | 2015 Jan | 2014 Dec | 2014 Nov | 2014 Oct | 2014 Sep | 2014 Aug | 2014 Jul | 2014 Jun | 2014 May | 2014 Apr | 2014 Mar | 2014 Feb | 2014 Jan | 2013 Dec | 2013 Nov | 2013 Oct | 2013 Sep | 2013 Aug | 2013 Jul | 2013 Jun | 2013 May | 2013 Apr | 2013 Mar | 2013 Feb | 2013 Jan | 2012 Dec | 2012 Nov | 2012 Oct | 2012 Sep | 2012 Aug | 2012 Jul | 2012 Jun | 2012 May | 2012 Apr | 2012 Mar | 2012 Feb | 2012 Jan | 2011 Dec | 2011 Nov | 2011 Oct | 2011 Sep | 2011 Aug | 2011 Jul | 2011 Jun | 2011 May | 2011 Apr | 2011 Mar | 2011 Feb | 2011 Jan | 2010 Dec | 2010 Nov | 2010 Oct | 2010 Sep | 2010 Aug | 2010 Jul | 2010 Jun | 2010 May | 2010 Apr | 2010 Mar | 2010 Feb | 2010 Jan | |
| CPI All-Items | 101.333 | 101.854 | 101.579 | 101.33 | 101.32 | 100.963 | 100.447 | 100.9 | 100.978 | 100.283 | 100.599 | 100.677 | 99.908 | 100.661 | 100.387 | 100.119 | 100.645 | 100.414 | 99.818 | 100.104 | 100.209 | 99.426 | 99.712 | 99.755 | 98.752 | 99.177 | 98.808 | 98.974 | 98.776 | 98.278 | 97.417 | 97.645 | 97.181 | 96.869 | 96.792 | 96.308 | 95.772 | 95.591 | 95.396 | 94.475 | 94.854 | 94.445 | 93.563 | 93.423 | 92.502 | 91.594 | 91.715 | 90.59 | 89.81 | 89.781 | 89.369 | 88.5 | 88.248 | 87.882 | 87.398 | 87.569 | 87.574 | 86.875 | 87.019 | 86.827 | 86.334 | 86.358 | 86.047 | 85.709 | 86.073 | 85.787 | 85.245 | 85.52 | 85.502 | 85.098 | 85.888 | 86.183 | 86.121 | 86.325 | 86.16 | 85.883 | 86.069 | 86.123 | 85.587 | 85.974 | 86.221 | 85.73 | 85.917 | 85.901 | 85.416 | 85.67 | 85.606 | 85.465 | 85.729 | 85.749 | 85.39 | 85.514 | 85.466 | 84.937 | 85.337 | 85.51 | 85.11 | 85.274 | 85.358 | 84.865 | 85.11 | 85.129 | 84.845 | 85.043 | 85.164 | 84.877 | 85.136 | 85.1 | 85.102 | 84.954 | 84.822 | 84.551 | 84.794 | 84.786 | 84.37 | 84.607 | 83.983 | 84.534 | 84.577 | 84.542 | 84.628 | 84.814 | 84.807 | 84.637 | 85.003 | 85.002 | 84.921 | 85.225 | 85.317 | 84.93 | 85.463 | 85.257 | 85.179 | 85.363 | 85.46 | 85.3 | 85.556 | 85.714 | 85.258 | 85.513 | 85.656 | 85.369 | 85.719 | 85.491 | 85.511 | 85.417 | 85.689 | 85.088 | 84.954 | 84.829 | 84.151 | 83.917 | 83.746 | 83.448 | 84.703 | 85.162 | 84.315 | 84.151 | 83.54 | 83.434 | 83.604 | 83.128 | 82.614 | 82.423 | 82.418 | 82.245 | 81.806 | 81.19 | 81.412 | 80.663 | 80.63 | 80.183 | 79.856 | 80.005 | 79.433 | 78.277 | 78.462 | 77.992 | 77.722 | 77.618 | 77.674 | 76.427 | 76.312 | 76.06 | 75.72 | 75.677 | 75.329 | 74.377 | 75.093 | 74.664 | 73.987 | 73.93 | 73.616 |
| Headline Inflation Rate (%) [Year-on-Year] | 1.4 | 1.2 | 1.2 | 1.2 | 0.7 | 0.5 | 0.6 | 0.8 | 0.8 | 0.9 | 0.9 | 0.9 | 1.2 | 1.5 | 1.6 | 1.2 | 1.9 | 2.2 | 2.5 | 2.5 | 3.1 | 2.6 | 3 | 3.6 | 3.1 | 3.8 | 3.6 | 4.8 | 4.1 | 4.1 | 4.1 | 4.5 | 5.1 | 5.8 | 5.5 | 6.3 | 6.6 | 6.5 | 6.7 | 6.8 | 7.5 | 7.5 | 7.1 | 6.7 | 5.6 | 5.4 | 5.4 | 4.3 | 4 | 4 | 3.9 | 3.3 | 2.5 | 2.4 | 2.5 | 2.4 | 2.4 | 2.1 | 1.3 | 0.7 | 0.2 | 0 | -0.1 | -0.2 | 0 | -0.4 | -0.4 | -0.5 | -0.8 | -0.7 | 0 | 0.3 | 0.8 | 0.8 | 0.6 | 0.5 | 0.4 | 0.4 | 0.2 | 0.5 | 0.9 | 0.9 | 0.7 | 0.5 | 0.4 | 0.5 | 0.3 | 0.7 | 0.7 | 0.7 | 0.6 | 0.6 | 0.4 | 0.1 | 0.2 | 0.5 | 0 | 0.4 | 0.6 | 0.4 | 0.4 | 0.4 | 0.6 | 0.5 | 1.4 | 0.4 | 0.7 | 0.7 | 0.6 | 0.2 | 0 | -0.1 | -0.2 | -0.3 | -0.6 | -0.7 | -1.6 | -0.5 | -1 | -0.8 | -0.6 | -0.6 | -0.8 | -0.8 | -0.6 | -0.8 | -0.4 | -0.3 | -0.4 | -0.5 | -0.3 | -0.3 | -0.4 | -0.1 | -0.3 | 0.2 | 0.7 | 1 | 1.3 | 1.9 | 2.3 | 2.3 | 1.2 | 0.4 | 1.4 | 1.5 | 2.6 | 2 | 1.6 | 2 | 1.9 | 1.8 | 1.6 | 1.5 | 3.5 | 4.9 | 3.6 | 4.3 | 3.6 | 4.1 | 4.7 | 3.9 | 4 | 5.3 | 5 | 5.5 | 5.3 | 4.6 | 4.8 | 5.5 | 5.7 | 5.4 | 5.5 | 5.7 | 5.4 | 5.2 | 4.5 | 4.5 | 5 | 5 | 5.5 | 4.6 | 3.8 | 3.5 | 3.7 | 3.3 | 3.1 | 2.7 | 3.3 | 3.2 | 1.6 | 1 | 0.2 |
The headline inflation rate in Jan 2026 was 1.4%. The highest figure over the past 10 years was 7.5%, and that was in Sep and Aug 2022.
MAS Core Inflation (core)
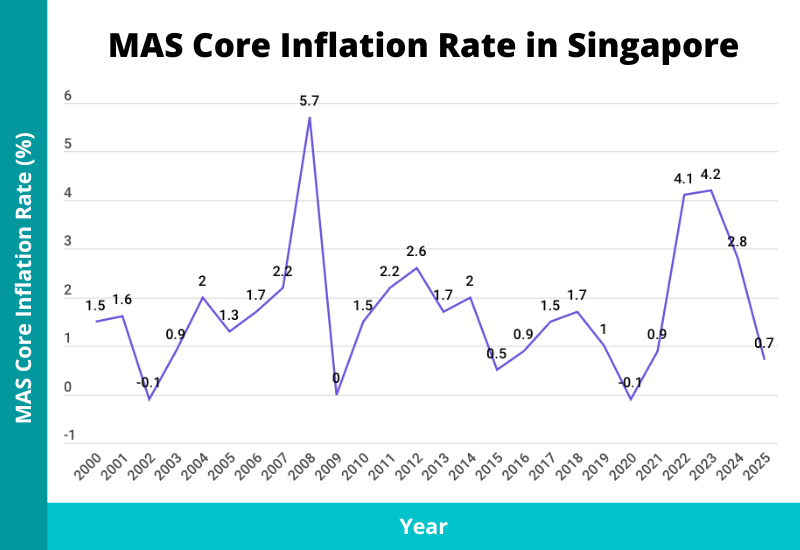
| 2025 | 2024 | 2023 | 2022 | 2021 | 2020 | 2019 | 2018 | 2017 | 2016 | 2015 | 2014 | 2013 | 2012 | 2011 | 2010 | 2009 | 2008 | 2007 | 2006 | 2005 | 2004 | 2003 | 2002 | 2001 | 2000 | 1999 | 1998 | 1997 | 1996 | 1995 | 1994 | 1993 | 1992 | 1991 | 1990 | |
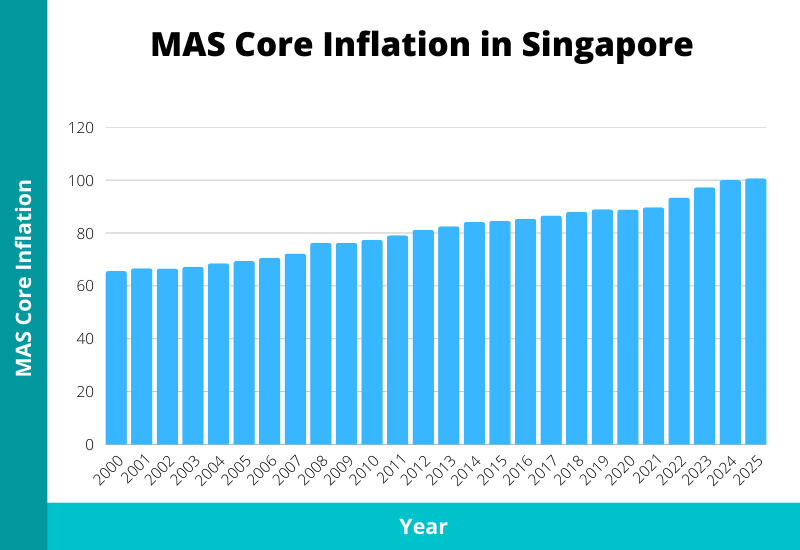
| MAS Core Inflation | 100.707 | 100 | 97.316 | 93.418 | 89.71 | 88.872 | 88.997 | 88.077 | 86.618 | 85.377 | 84.612 | 84.194 | 82.575 | 81.18 | 79.156 | 77.473 | 76.309 | 76.324 | 72.2 | 70.629 | 69.442 | 68.578 | 67.238 | 66.608 | 66.644 | 65.621 | 64.659 | 64.336 | 64.086 | 63.113 | 62 | 60.669 | 59.177 | 58.145 | 57.235 | 55.21 |
| Core Inflation Rate (%) | 0.7 | 2.8 | 4.2 | 4.1 | 0.9 | -0.1 | 1 | 1.7 | 1.5 | 0.9 | 0.5 | 2 | 1.7 | 2.6 | 2.2 | 1.5 | 0 | 5.7 | 2.2 | 1.7 | 1.3 | 2 | 0.9 | -0.1 | 1.6 | 1.5 | 0.5 | 0.4 | 1.5 | 1.8 | 2.2 | 2.5 | 1.8 | 1.6 | 3.7 | na |
The core inflation rate in 2025 was 0.7%. Over a period of 30 years from 1995 to 2025, the highest annual inflation was 5.7% in 2008, while the lowest was -0.2% in 2020.
From 2005 to 2025, the MAS Core Inflation rose 45.0%. Hypothetically, this would also mean that over a period of 20 years, a $10 basket of regular day-to-day expenses in 2005 would cost $14.50 in 2025.
Below, we look at the core inflation on a year-on-year basis.
| 2026 Jan | 2025 Dec | 2025 Nov | 2025 Oct | 2025 Sep | 2025 Aug | 2025 Jul | 2025 Jun | 2025 May | 2025 Apr | 2025 Mar | 2025 Feb | 2025 Jan | 2024 Dec | 2024 Nov | 2024 Oct | 2024 Sep | 2024 Aug | 2024 Jul | 2024 Jun | 2024 May | 2024 Apr | 2024 Mar | 2024 Feb | 2024 Jan | 2023 Dec | 2023 Nov | 2023 Oct | 2023 Sep | 2023 Aug | 2023 Jul | 2023 Jun | 2023 May | 2023 Apr | 2023 Mar | 2023 Feb | 2023 Jan | 2022 Dec | 2022 Nov | 2022 Oct | 2022 Sep | 2022 Aug | 2022 Jul | 2022 Jun | 2022 May | 2022 Apr | 2022 Mar | 2022 Feb | 2022 Jan | 2021 Dec | 2021 Nov | 2021 Oct | 2021 Sep | 2021 Aug | 2021 Jul | 2021 Jun | 2021 May | 2021 Apr | 2021 Mar | 2021 Feb | 2021 Jan | 2020 Dec | 2020 Nov | 2020 Oct | 2020 Sep | 2020 Aug | 2020 Jul | 2020 Jun | 2020 May | 2020 Apr | 2020 Mar | 2020 Feb | 2020 Jan | 2019 Dec | 2019 Nov | 2019 Oct | 2019 Sep | 2019 Aug | 2019 Jul | 2019 Jun | 2019 May | 2019 Apr | 2019 Mar | 2019 Feb | 2019 Jan | 2018 Dec | 2018 Nov | 2018 Oct | 2018 Sep | 2018 Aug | 2018 Jul | 2018 Jun | 2018 May | 2018 Apr | 2018 Mar | 2018 Feb | 2018 Jan | 2017 Dec | 2017 Nov | 2017 Oct | 2017 Sep | 2017 Aug | 2017 Jul | 2017 Jun | 2017 May | 2017 Apr | 2017 Mar | 2017 Feb | 2017 Jan | 2016 Dec | 2016 Nov | 2016 Oct | 2016 Sep | 2016 Aug | 2016 Jul | 2016 Jun | 2016 May | 2016 Apr | 2016 Mar | 2016 Feb | 2016 Jan | 2015 Dec | 2015 Nov | 2015 Oct | 2015 Sep | 2015 Aug | 2015 Jul | 2015 Jun | 2015 May | 2015 Apr | 2015 Mar | 2015 Feb | 2015 Jan | 2014 Dec | 2014 Nov | 2014 Oct | 2014 Sep | 2014 Aug | 2014 Jul | 2014 Jun | 2014 May | 2014 Apr | 2014 Mar | 2014 Feb | 2014 Jan | 2013 Dec | 2013 Nov | 2013 Oct | 2013 Sep | 2013 Aug | 2013 Jul | 2013 Jun | 2013 May | 2013 Apr | 2013 Mar | 2013 Feb | 2013 Jan | 2012 Dec | 2012 Nov | 2012 Oct | 2012 Sep | 2012 Aug | 2012 Jul | 2012 Jun | 2012 May | 2012 Apr | 2012 Mar | 2012 Feb | 2012 Jan | 2011 Dec | 2011 Nov | 2011 Oct | 2011 Sep | 2011 Aug | 2011 Jul | 2011 Jun | 2011 May | 2011 Apr | 2011 Mar | 2011 Feb | 2011 Jan | 2010 Dec | 2010 Nov | 2010 Oct | 2010 Sep | 2010 Aug | 2010 Jul | 2010 Jun | 2010 May | 2010 Apr | 2010 Mar | 2010 Feb | 2010 Jan | |
| MAS Core Inflation | 101.316 | 101.662 | 101.216 | 101.269 | 100.753 | 100.49 | 100.432 | 100.566 | 100.65 | 100.648 | 100.194 | 100.329 | 100.27 | 100.439 | 99.976 | 100.065 | 100.396 | 100.16 | 99.974 | 100.006 | 100.07 | 99.95 | 99.694 | 99.774 | 99.501 | 98.745 | 98.116 | 97.997 | 97.615 | 97.49 | 97.407 | 97.209 | 97.028 | 96.941 | 96.566 | 96.329 | 96.346 | 95.563 | 95.033 | 94.828 | 94.723 | 94.283 | 93.82 | 93.282 | 92.682 | 92.333 | 91.915 | 91.278 | 91.274 | 90.89 | 90.385 | 90.186 | 89.933 | 89.732 | 89.509 | 89.309 | 89.47 | 89.345 | 89.335 | 89.303 | 89.127 | 88.998 | 88.908 | 88.879 | 88.854 | 88.707 | 88.572 | 88.759 | 88.742 | 88.796 | 88.881 | 89.124 | 89.247 | 89.223 | 88.953 | 89.009 | 88.94 | 88.962 | 88.89 | 88.905 | 88.888 | 89.022 | 89.023 | 89.182 | 88.964 | 88.712 | 88.455 | 88.576 | 88.416 | 88.384 | 88.385 | 87.939 | 87.775 | 87.764 | 87.535 | 87.669 | 87.318 | 87.073 | 86.99 | 86.955 | 86.819 | 86.723 | 86.75 | 86.481 | 86.484 | 86.624 | 86.224 | 86.182 | 86.116 | 85.936 | 85.715 | 85.651 | 85.571 | 85.493 | 85.406 | 85.165 | 85.134 | 85.192 | 85.199 | 85.192 | 84.867 | 84.886 | 84.652 | 84.721 | 84.794 | 84.637 | 84.573 | 84.243 | 84.271 | 84.498 | 84.727 | 84.793 | 84.546 | 84.674 | 84.512 | 84.505 | 84.305 | 84.428 | 84.254 | 84.086 | 84.185 | 84.13 | 83.848 | 83.668 | 83.727 | 83.39 | 83.315 | 83.048 | 82.821 | 82.795 | 82.42 | 82.341 | 82.332 | 82.196 | 82.153 | 82.226 | 81.868 | 81.711 | 81.57 | 81.551 | 81.43 | 81.342 | 81.142 | 80.959 | 80.985 | 81.083 | 80.793 | 80.709 | 80.882 | 80.186 | 79.99 | 79.76 | 79.521 | 79.544 | 79.233 | 78.854 | 78.855 | 78.944 | 78.478 | 78.377 | 78.129 | 78.111 | 78.122 | 77.961 | 77.843 | 77.858 | 77.554 | 77.092 | 77.203 | 77.252 | 77.077 | 77.005 | 76.598 |
| Core Inflation Rate (%) [Year-on-Year] | 1 | 1.2 | 1.2 | 1.2 | 0.4 | 0.3 | 0.5 | 0.6 | 0.6 | 0.7 | 0.5 | 0.6 | 0.8 | 1.7 | 1.9 | 2.1 | 2.8 | 2.7 | 2.6 | 2.9 | 3.1 | 3.1 | 3.2 | 3.6 | 3.3 | 3.3 | 3.2 | 3.3 | 3.1 | 3.4 | 3.8 | 4.2 | 4.7 | 5 | 5.1 | 5.5 | 5.6 | 5.1 | 5.1 | 5.1 | 5.3 | 5.1 | 4.8 | 4.4 | 3.6 | 3.3 | 2.9 | 2.2 | 2.4 | 2.1 | 1.7 | 1.5 | 1.2 | 1.2 | 1.1 | 0.6 | 0.8 | 0.6 | 0.5 | 0.2 | -0.1 | -0.3 | -0.1 | -0.1 | -0.1 | -0.3 | -0.4 | -0.2 | -0.2 | -0.3 | -0.2 | -0.1 | 0.3 | 0.6 | 0.6 | 0.5 | 0.6 | 0.7 | 0.6 | 1.1 | 1.3 | 1.4 | 1.7 | 1.7 | 1.9 | 1.9 | 1.7 | 1.9 | 1.8 | 1.9 | 1.9 | 1.7 | 1.5 | 1.3 | 1.5 | 1.7 | 1.4 | 1.3 | 1.5 | 1.5 | 1.5 | 1.4 | 1.6 | 1.5 | 1.6 | 1.7 | 1.2 | 1.2 | 1.5 | 1.2 | 1.3 | 1.1 | 0.9 | 1 | 1 | 1.1 | 1 | 0.8 | 0.6 | 0.5 | 0.4 | 0.3 | 0.2 | 0.3 | 0.6 | 0.2 | 0.4 | 0.2 | 0.1 | 0.4 | 1 | 1.3 | 1 | 1.5 | 1.4 | 1.8 | 1.8 | 2 | 2.2 | 2.1 | 2.3 | 2.4 | 2.1 | 1.8 | 2.3 | 2.1 | 2.1 | 1.8 | 1.7 | 1.8 | 1.6 | 1.7 | 1.7 | 1.4 | 1.7 | 1.9 | 1.2 | 1.9 | 2 | 2.2 | 2.4 | 2.3 | 2.4 | 2.7 | 2.7 | 2.7 | 2.9 | 3 | 3.5 | 2.7 | 2.4 | 2.3 | 2.2 | 2.2 | 2.2 | 2.3 | 2.1 | 2.2 | 1.8 | 1.8 | 2 | 2.1 | 2.2 | 2 | 2.4 | 2.4 | 2 | 1.8 | 1.7 | 1.6 | 0.4 | 0.4 | -0.5 |
The MAS core inflation rate in Jan 2026 was 1%. Since Jul 2014 (2.2%), the highest core inflation was 5.5% and that was in Jan and Feb 2023.
Overall, if we were to combine both graphs of the CPI All-Items and the MAS Core Inflation together, here’s what it’ll look like:
Singapore’s Inflation Rate Forecast (2026)
According to MAS, in 2026, both the CPI All-Items inflation and MAS Core Inflation are forecasted to be 1.0–2.0%.
What Is the Average Annual Inflation Rate in Singapore?
In financial planning, one of the most common applications for an average annual inflation rate is the ability to project future costs.
It is essential to do so because you can’t just take your current level of expenses and expect it to be the same decades later; costs will rise.
Using a constant average rate of inflation – though it may not be reflective of actual price increases – provides simplicity in planning since inflation rates fluctuate all the time.
In order to calculate the average, you can’t just take the sum of the annual inflation rates over a period and divide it by the number of years.
Instead, this formula should be used: PV (1+r)^n = FV
Where
r = the compound average annual rate of inflation
n = the number of years
PV = the CPI for the 1st Year
FV = the CPI for the 2nd Year
(We can use a financial calculator for this.)
And here are the average annual inflation rates in Singapore:
| Average Headline Inflation Rate (CPI All-Items) | Average Core Inflation Rate (MAS Core Inflation) | |
|---|---|---|
| Over the last 10 years (2015 to 2025) | 1.72% | 1.76% |
| Over the last 20 years (2005 to 2025) | 2.14% | 1.88% |
| Over the last 30 years (1995 to 2025) | 1.68% | 1.63% |
Why Is Singapore’s Inflation Rate So Low?
When you look at the average yearly inflation rates above, you may wonder why they are so low, because it often doesn’t feel like that in daily life.
One reason for this could be our own unique experiences and perceptions. For example, when we only pay attention to certain items that we don’t purchase often and notice a “sudden” increase, we may think that prices are rising at a fast pace.
Another reason for this “disconnect” is because of a limitation to the CPI’s data.
In compiling the prices of different goods and services, a fixed basket has to be used since it’s almost impossible to track the price of every single item out there. As a result, actual household expenses may deviate from these data (i.e., not all households buy the same items).
Having said that, the data still provide meaningful insights.
How to Project Future Costs?
Taking a look at the average rates, we can see that they don’t exceed 2.00%.
To project future costs, we should include a buffer in order to ensure that we still have enough in case things go sideways. For that, you could assume a rate of 3.00 or 4.00%.
To calculate how much you need for retirement, you can simply take your expected expenses during retirement (in today’s value) and apply an inflation rate of, say, 3.00% over the number of years to your retirement age. Or, you can simply use a retirement planning calculator.
The same concept applies to calculating your children’s education fund.
Apart from projecting future costs, you can also estimate the “real” rate of return on an investment by simply taking the expected rate from that investment and subtracting the inflation rate.
In knowing the average inflation, you can also see how your cash is devaluing over time. To illustrate, if you leave $10,000 in the bank while earning 0.05% per year with an annual inflation of 3%, that “value” is worth only $5,494.28 after 20 years.
What Can You Do About the Rising Cost of Living and How to Beat Inflation?
A moderate amount of inflation is perfectly normal in a growing economy.
Singapore has gone through good economic growth, and its standard of living (and the costs of it) have gone up since its independence.
It’s very likely that inflation will continue for a long time, and along with it, effects such as the rising cost of living and cash in the bank losing value over time.
So what can we do to prepare for this?
Firstly, it’s vital to have the various types of insurance plans in place, so that your income and your wealth can remain protected.
Outside of having sufficient emergency funds and short-term financial goals and commitments, you should consider placing your excess cash into various alternatives that can provide potentially higher returns above the average annual inflation rate.
If you’re planning for your retirement, consider some options to invest your money, depending on your risk appetite.
BEFORE YOU GO
Articles can tell you what generally makes sense. They can't see your policies, your CPF, or your plans.
FullCircle is our comprehensive financial planning session. A licensed consultant goes through what you have, shows you the gaps and overlaps, and tells you what to prioritise across protection, retirement, and estate planning.
It's complimentary, takes about 45 minutes, and if nothing needs changing, we'll say so.