
When it comes to life insurance, emotion often drives our decisions. We ask ourselves, “If I were no longer around, how would my family manage financially?”
However, we frequently overlook the logical aspect.
This article adopts a fresh, data-driven approach to understanding life insurance policies — covering not just death, but also Total and Permanent Disability (TPD) and Critical Illness (CI).
We spent 57 hours analysing 36 months of life insurance claims data in Singapore. Below are the findings.
Summary of Key Findings
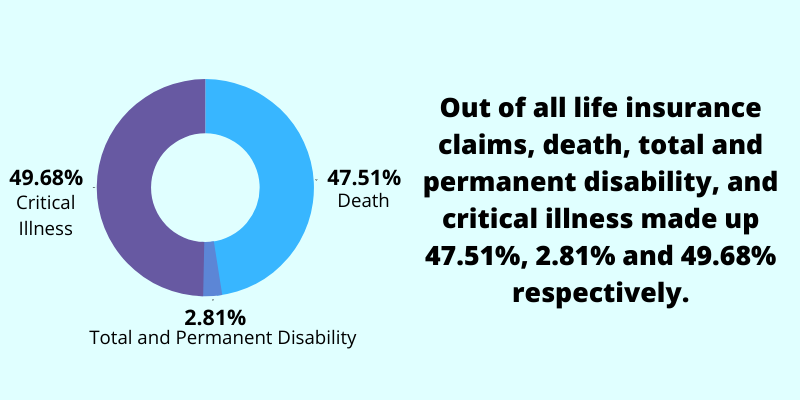
- Among all life insurance claims, death, total and permanent disability (TPD), and critical illness (CI) accounted for 47.51%, 2.81%, and 49.68%, respectively.
- Here are the average claim payouts for each category:
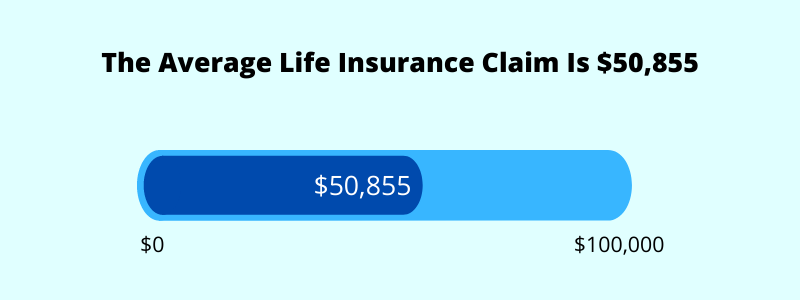
- Overall Average: $50,855.98
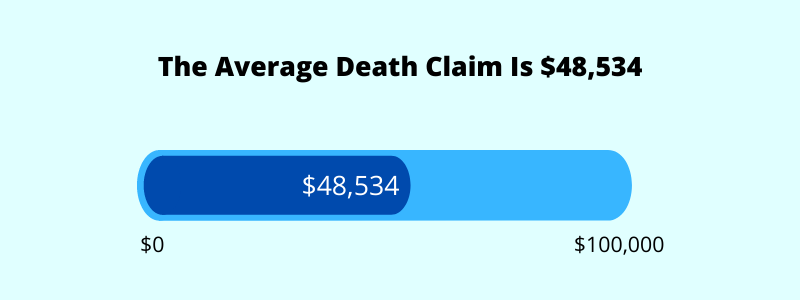
- Death: $48,534.11
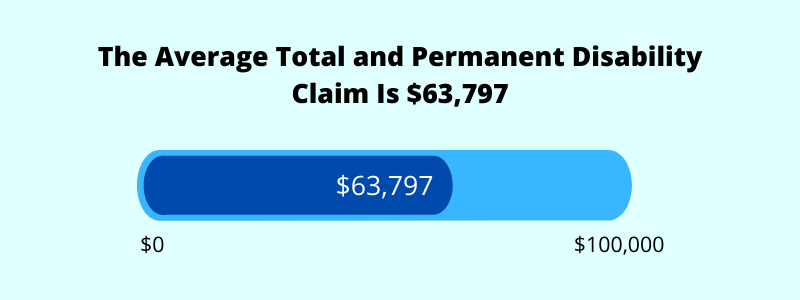
- TPD: $63,797.76
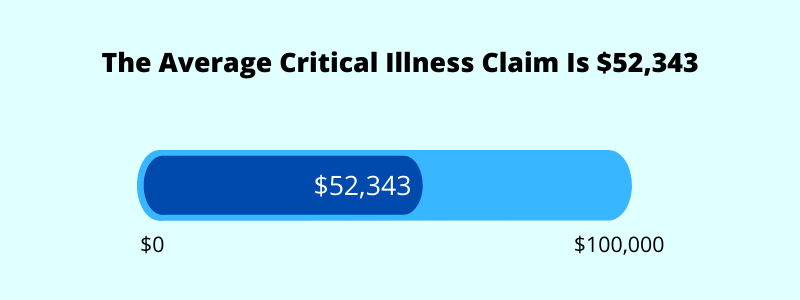
- CI: $52,343.37
- Only 13.90% of claims exceed $100,000, but these larger claims make up 56.18% of total payouts. On the other hand, 86.10% of claims are below $100,000, accounting for just 43.82% of total payouts.
- For claims of $100,000 and above, cancer is the leading cause of claims — not only for death (making up 39.67% of such claims) but also for critical illness (73.17%).
- Most claims for policies exceeding $100,000 — whether for death, TPD, or CI — fall within the $100,000 to $199,999 range.
Read on for more details and insights into these statistics.
SIDE NOTE
A policy bought years ago. Savings in three places. A will that's still on the to-do list.
None of it is wrong. It's just not a plan yet.
There's an order that turns the pieces into one system, and it doesn't require becoming a finance expert. Here's the order, in 7 steps, so you know what to sort out first.
The Objective of This Study
We buy life insurance for the “what-ifs” in life.
But when someone asks why we bought it, the answer often sounds like, “Because my agent told me to.”
This study aims to dig deeper — to quantify those “what-ifs” and provide a more objective perspective on insurance.
The goal is to turn raw data (which often doesn’t say much on its own) into meaningful insights. That way, you can confidently say you bought life insurance because of this or for that reason — not just because someone told you to.
The Data We’re Analysing
Most insurance companies don’t share detailed claim statistics.
But one stands out — Income Insurance (formerly NTUC Income).
As of 27 January 2022, the available data spans January 2016 to June 2019. For simplicity, we’re focusing on July 2016 to June 2019 — a 36-month (or 3-year) period — for analysis.
The dataset includes:
- The total number of claims for life insurance, categorised by death, total and permanent disability (TPD), and critical illness (CI).
- The total claim payouts, broken down by type of claim.
- Detailed information on individual claims of $100,000 or more, including age, cause of claim, and exact payout amounts.
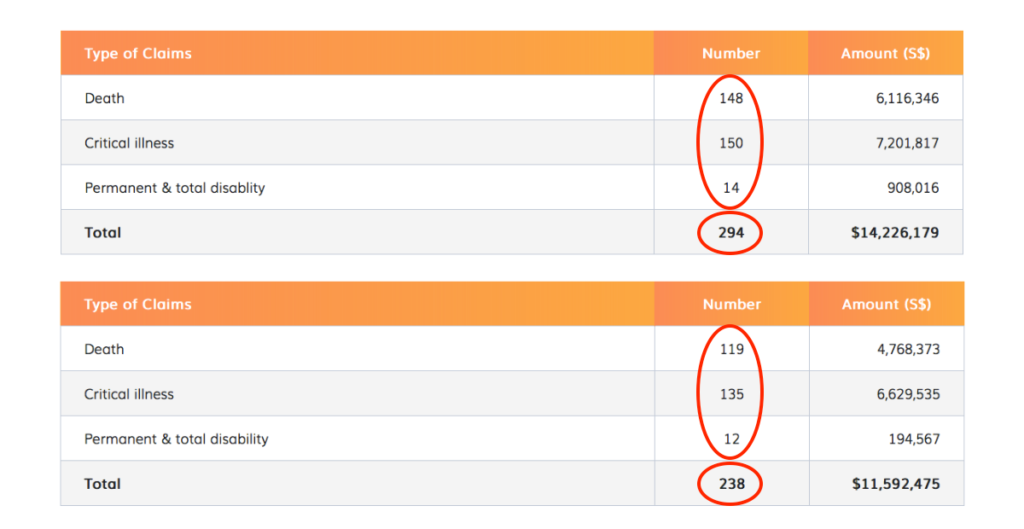
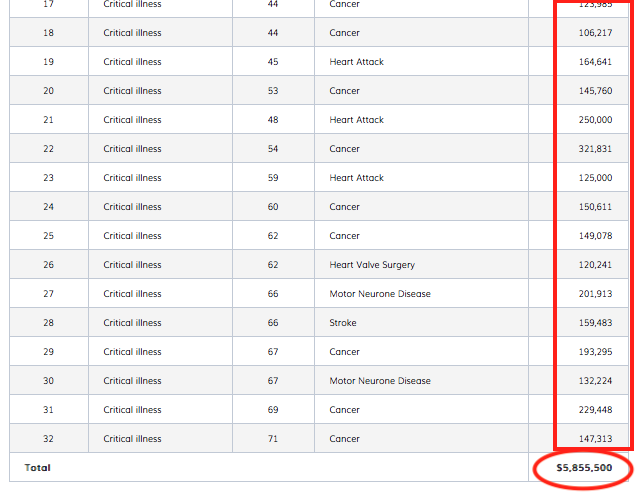
Here’s a closer look at the monthly data Income Insurance provides:
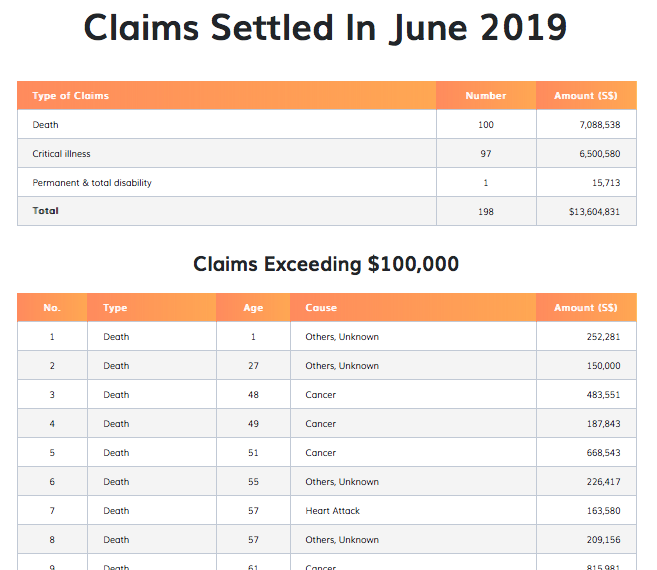
And here’s a look at what 36 months of data look like:

We organised and tabulated everything to present our findings in a simple and easy-to-understand way.
4 Limitations to This Study
As with any study, achieving a perfect scenario is impossible.
Assumptions need to be made, and we have to work with the data available. While we’re not professional researchers, we’ve done our best to present accurate results and show them exactly as they are.
Here are the four key limitations:
1) Data is from only one company
The data used in this study comes exclusively from one company, as no comparable data is available from others.
Having data from multiple insurers would provide a broader perspective since outcomes can vary across companies. Additionally, many customers hold policies from multiple insurers.
That said, this dataset still provides valuable insights.
One consideration is the definitions of claims. Terms like Death, Total and Permanent Disability (TPD), and Critical Illness (CI) (limited to about 30+ conditions) are fairly standard across the industry. However, it’s unclear if early critical illness is included in this data.
The types of policies — such as term life, whole life, early critical illness insurance, and others — are also unspecified, which could influence the results.
2) Data only represents successful claims
The figures and details presented here are based solely on successful claims from policyholders.
This means the data does not reflect the overall probability of death, disability, or critical illness. Assessing those probabilities lies outside the scope of this study.
Additionally, these figures are based on past policies and claims, which may not fully represent how future claims will unfold.
3) Specific details are limited to claims of $100,000 or more
Individual claim details — such as cause of claim, age of the policyholder, and claim amount — are only available for claims of $100,000 or more.
This creates a limitation, as younger individuals often have lower coverage amounts, meaning the data may skew toward older policyholders.
It’s worth keeping this in mind when interpreting the findings.
4) Minor discrepancies in the data
During data compilation, a few discrepancies were identified:
- July 2016 and May 2017: The figures didn’t fully add up. We resolved this by summing the three relevant rows where attribution was clear.
- 36-month total: The sum of individual claim amounts across 36 months was $246,670,471, while the reported “Total” figure was $246,611,159 — a difference of $59,312.
These discrepancies are minor and have an insignificant impact on the overall analysis.
Despite these limitations, the data provides meaningful insights into life insurance claims. Let’s dive into the findings.
1) Death accounts for 47.51% of all life insurance claims
The total number of life insurance claims throughout these 36 months is 8,634, of which 4,102 are from death.
This translates to a percentage of 47.51% (4,102/8,634).
At the same time, there is an average of 1,367.34 (4,102/3) death claims per year.
2) The average death claim payout is $48,534.11
The total payout of death claims throughout these 36 months is $199,086,911.
This also means that the average death claim payout per year is $66,362,303.70.
The average death claim payout is $48,534.11 ($199,086,911/4,102).
KEY TAKEAWAY
Death represents a huge percentage of life insurance claims. What’s important to note here is the average death claim payout of $48,534.11. Assuming that there are no other insurance payouts, that amount may be insignificant especially when other family members depend on it. It might not last long.
3) Total and permanent disability accounts for 2.81% of all life insurance claims
Of the total life insurance claims (8,634) throughout these 36 months, only 243 are from total and permanent disability (TPD).
The percentage of this is 2.81% (243/8,634).
At the same time, there is an average of 81 (243/3) TPD claims per year.
4) The average total and permanent disability claim payout is $63,797.76
The total payout of TPD claims throughout these 36 months is $15,502,854.
This translates to an average TPD claim payout of $5,167,618 per year.
The average TPD claim is $63,797.76 ($15,502,854/243).
KEY TAKEAWAY
TPD has always been claimed the least. In my opinion, the chances of a TPD claim are lower compared to the other two. And this is reflected in the premiums you pay for TPD coverage – very affordable. Just like death, the average claim payout can be seen as low especially when you’re unable to perform any form of work to earn an income, yet you still need to pay for daily expenses and other commitments for the rest of your life.
5) Critical illness accounts for 49.68% of all life insurance claims
There are 4,289 claims from critical illness (CI) out of the total life insurance claims (8,634).
The percentage of this is 49.68% (4,289/8,634).
At the same time, there is an average of 1,429.67 (4,289/3) CI claims per year.
6) The average critical illness claim payout is $52,343.37
Throughout these 36 months, the total payout of CI claims is $224,500,696.
Bringing the average CI claim payout per year to be at $78,833,565.30.
The average CI claim payout is $52,343.37 ($224,500,696/4,289).
KEY TAKEAWAY
Critical illness accounts for the highest percentage of all life insurance claims. Rightfully so because you don’t need to experience death to be able to claim from CI, and the probability of a CI happening may be high. This is also the reason why premium for CI coverage is higher than the rest. Having said that, it’s still important to have some CI cover as it can potentially strip away your ability to work for a prolonged period.
QUICK CHECK
Can you answer these three questions?
1) If something happened to you tomorrow, how much would your family receive?
2) At 65, what monthly income will your savings and investments pay you?
3) If you never get round to a will, who inherits what, and in what proportion?
Most people manage one at best. Not because they're careless, but because nobody has shown them which order to tackle things in.
That order exists. Work through your finances in this sequence, from income and protection through to investments and estate planning.
7) The average life insurance payout is $50,855.98
Let’s take a look at the overall picture.
The total life insurance payouts for the 36 months is $439,090,461.
Dividing that number by the total number of claims of 8,634.
And we’ll get the average life insurance payout of $50,855.98.
KEY TAKEAWAY
Life insurance consists mainly of death, TPD and CI. If any of that happens, it’s likely that you’ll lose the ability to earn an income. Your payouts come into play. After that is used up, you need to utilise your hard-earned assets (cash at bank, investments, properties, etc). All in all, the average life insurance payout of $50,855.98 might not be enough to replace the potential loss of a lifetime income.
8) Only 13.90% of total claims are $100,000 and above
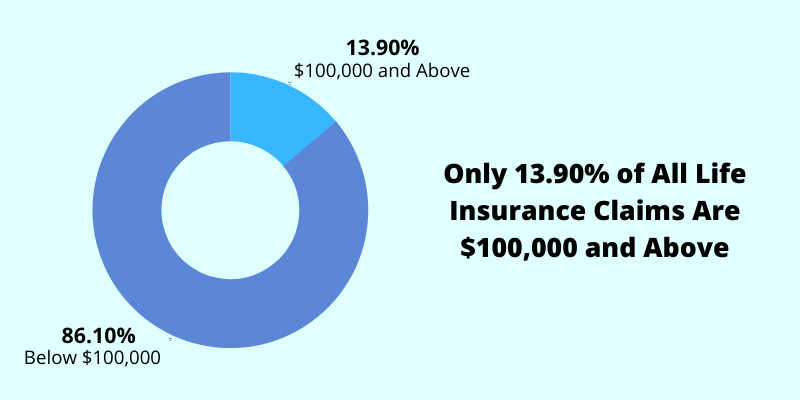
Out of 8,634 claims, only 1,200 are $100,000 and above.
This represents only 13.90% (1,200/8,634) of the total claims. On the other hand, 86.10% of claims are below $100,000.
9) The total claim payouts which are $100,000 and above account for 56.18% of all payouts
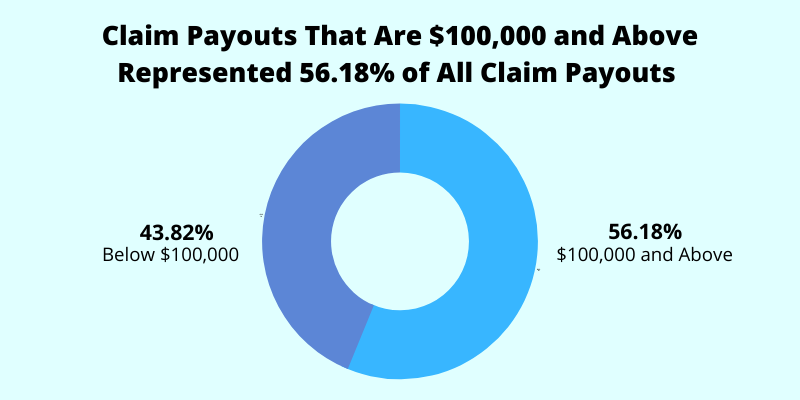
The total claim payouts ($100,000 and above) are at $246,670,471.
This represents 56.18% ($246,670,471/$439,090,461) of the total claims payout.
This also means that claims below $100,000 amounted to 43.82% of all claim payouts.
KEY TAKEAWAY
The above 2 findings reinforce the point that most Singaporeans may be underinsured. With only a small percentage of claims being $100,000 and above, yet they already account for more than half of all total payouts, one can only wonder what the situation would be like for the rest who receive less than $100,000 of claims.
Note: From this point onwards, specific data are only available for claims of $100,000 and more. Therefore, the following findings shouldn’t represent the overview of all claims and should never be taken out of context.
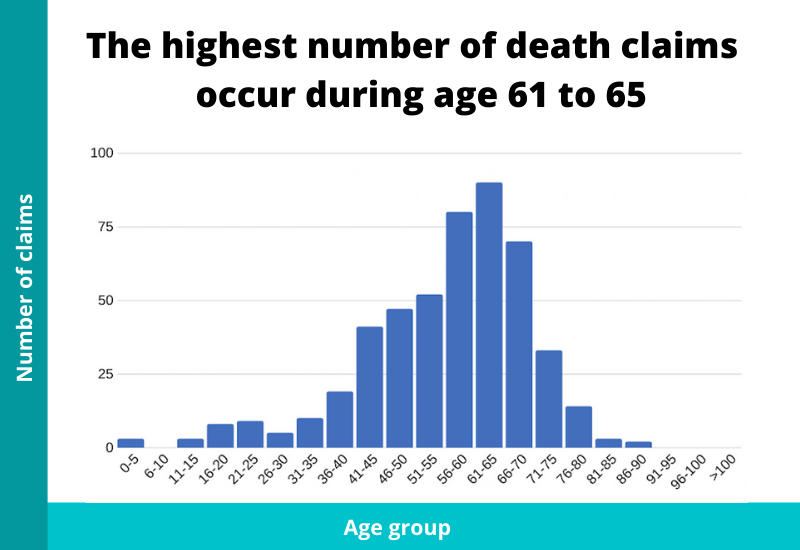
10) The highest number of death claims happen during age 61 to 65
| Age | No. of Claims |
| 0-5 | 3 |
| 6-10 | 0 |
| 11-15 | 3 |
| 16-20 | 8 |
| 21-25 | 9 |
| 26-30 | 5 |
| 31-35 | 10 |
| 36-40 | 19 |
| 41-45 | 41 |
| 46-50 | 47 |
| 51-55 | 52 |
| 56-60 | 80 |
| 61-65 | 90 |
| 66-70 | 70 |
| 71-75 | 33 |
| 76-80 | 14 |
| 81-85 | 3 |
| 86-90 | 2 |
| 91-95 | 0 |
| 96-100 | 0 |
| >100 | 0 |
KEY TAKEAWAY
What’s interesting is that although the life expectancy in Singapore is at 83.5 years, the majority of death claims happen before that. There may be 2 reasons to explain this. One is that term insurance would’ve expired and thus, if death were to happen after, there’s no claim. Second is that if one were to hold a whole life insurance, they might have surrendered the plan earlier. Both of these scenarios might lead to lesser death claims nearer to the life expectancy age.
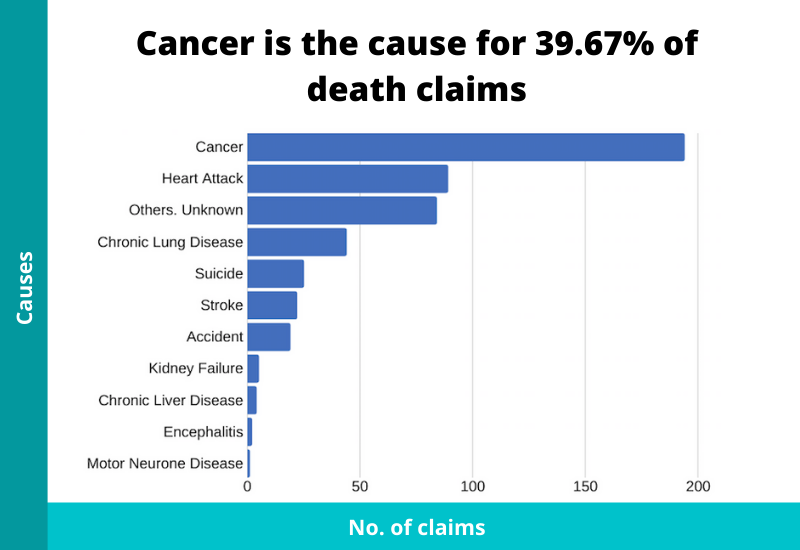
11) Cancer is the cause for 39.67% of all death claims
| Cause | No. of Claims |
| Cancer | 194 |
| Heart Attack | 89 |
| Others. Unknown | 84 |
| Chronic Lung Disease | 44 |
| Suicide | 25 |
| Stroke | 22 |
| Accident | 19 |
| Kidney Failure | 5 |
| Chronic Liver Disease | 4 |
| Encephalitis | 2 |
| Motor Neurone Disease | 1 |
There were 489 death claims. Of this figure, 194 is because of cancer. Thus, cancer accounted for 39.67% of all death claims, and is the number one cause of it.
KEY TAKEAWAY
People don’t die because of “old age”, they die (even when passing away peacefully) because there was an underlying issue. Which is why in death certificates, there’s always a specific cause. In Singapore, cancer has always been the talk of the town. It’s something to pay close attention to. Either to prevent or cure it.
12) The highest number of death claims due to cancer happen from age 61 to 65
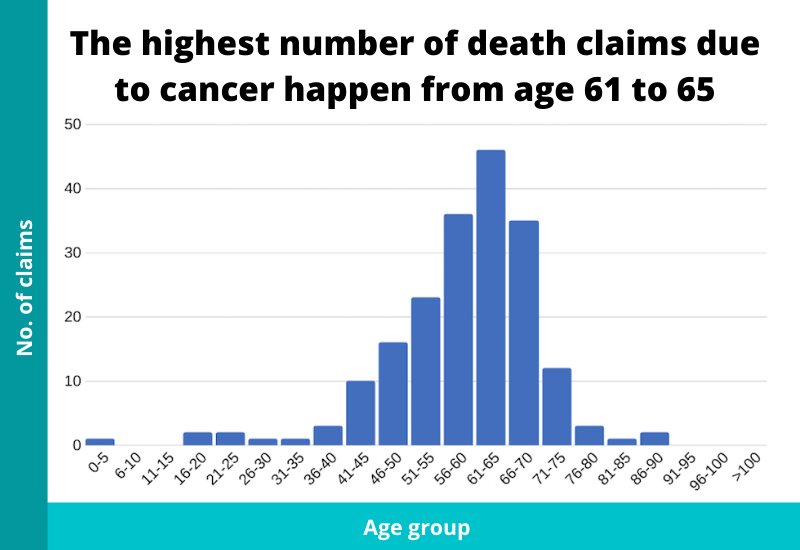
| Age | No. of Claims |
| 0-5 | 1 |
| 6-10 | 0 |
| 11-15 | 0 |
| 16-20 | 2 |
| 21-25 | 2 |
| 26-30 | 1 |
| 31-35 | 1 |
| 36-40 | 3 |
| 41-45 | 10 |
| 46-50 | 16 |
| 51-55 | 23 |
| 56-60 | 36 |
| 61-65 | 46 |
| 66-70 | 35 |
| 71-75 | 12 |
| 76-80 | 3 |
| 81-85 | 1 |
| 86-90 | 2 |
| 91-95 | 0 |
| 96-100 | 0 |
| >100 | 0 |
KEY TAKEAWAY
The cause of death claims – cancer and all types – from different ages don’t differ much because cancer represented the biggest percentage of all death claims.
13) The majority of death claims happen from $100,000 to $199,999
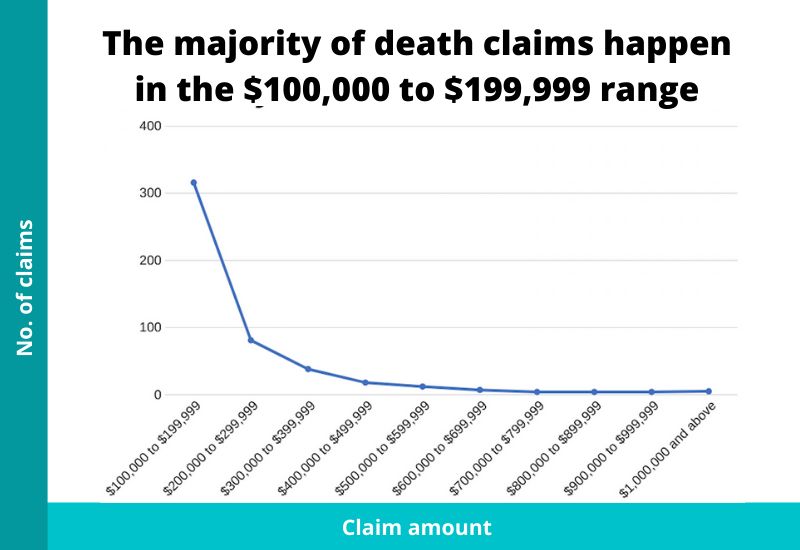
| Amount Claimed | No. of Claims |
| $100,000 to $199,999 | 316 |
| $200,000 to $299,999 | 81 |
| $300,000 to $399,999 | 38 |
| $400,000 to $499,999 | 18 |
| $500,000 to $599,999 | 12 |
| $600,000 to $699,999 | 7 |
| $700,000 to $799,999 | 4 |
| $800,000 to $899,999 | 4 |
| $900,000 to $999,999 | 4 |
| $1,000,000 and above | 5 |
KEY TAKEAWAY
Even for those who are covered for more than $100k, most are still in the $100k-200k region. The count drops off sharply after each range. Singapore is expensive with all the daily necessities, expenses for kids, etc. If you’re the sole-breadwinner or part of a dual-income household, is the payout enough?
14) The highest number of total and permanent disability claims happen during age 56 to 60
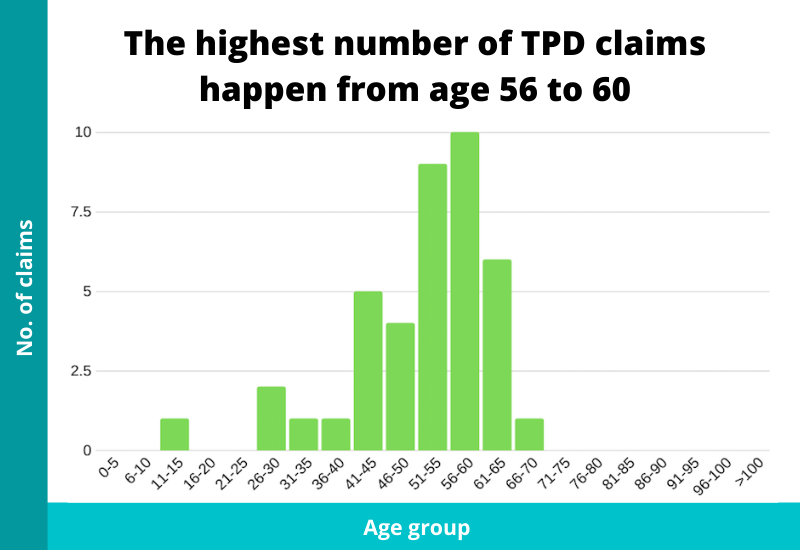
| Age | No. of Claims |
| 0-5 | 0 |
| 6-10 | 0 |
| 11-15 | 1 |
| 16-20 | 0 |
| 21-25 | 0 |
| 26-30 | 2 |
| 31-35 | 1 |
| 36-40 | 1 |
| 41-45 | 5 |
| 46-50 | 4 |
| 51-55 | 9 |
| 56-60 | 10 |
| 61-65 | 6 |
| 66-70 | 1 |
| 71-75 | 0 |
| 76-80 | 0 |
| 81-85 | 0 |
| 86-90 | 0 |
| 91-95 | 0 |
| 96-100 | 0 |
| >100 | 0 |
15) The top cause of TPD (claimed) is due to other medical conditions besides Stroke
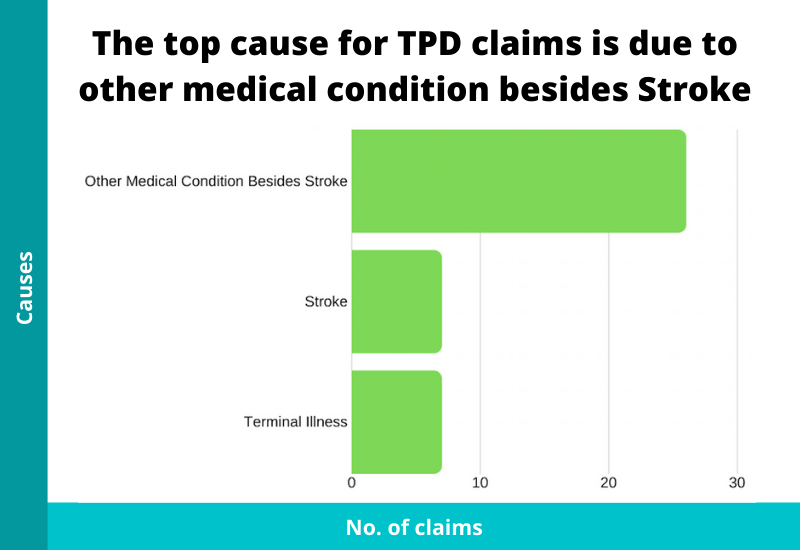
| Cause | No. of Claims |
| Due to Other Medical Condition Besides Stroke | 26 |
| Due to Stroke | 7 |
| Due to Terminal Illness | 7 |
16) The majority of TPD claims happen from $100,000 to $199,999
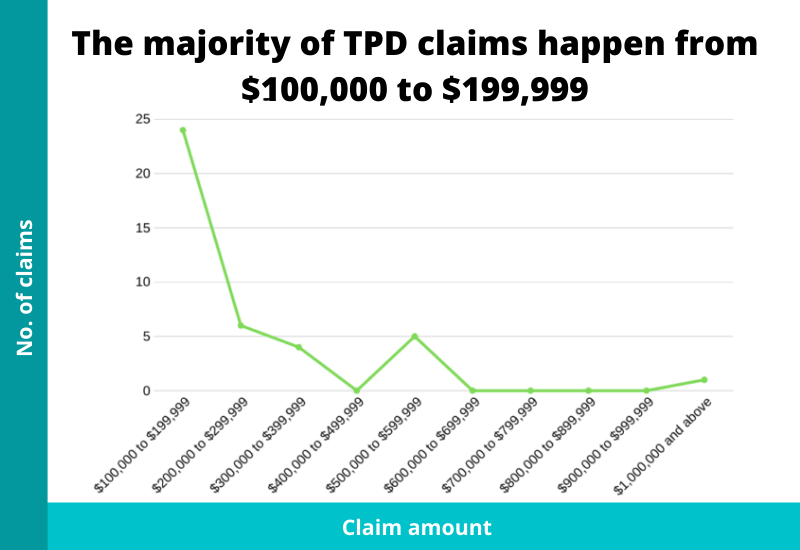
| Amount Claimed | No. of Claims |
| $100,000 to $199,999 | 24 |
| $200,000 to $299,999 | 6 |
| $300,000 to $399,999 | 4 |
| $400,000 to $499,999 | 0 |
| $500,000 to $599,999 | 5 |
| $600,000 to $699,999 | 0 |
| $700,000 to $799,999 | 0 |
| $800,000 to $899,999 | 0 |
| $900,000 to $999,999 | 0 |
| $1,000,000 and above | 1 |
KEY TAKEAWAY
The data for TPD is not significant to show any interesting findings. And the causes of TPD are vague too. Do take note that most TPD coverage from insurance companies lasts only till 65 or 70 years old.
17) The highest number of critical illness claims happen during age 51 to 55
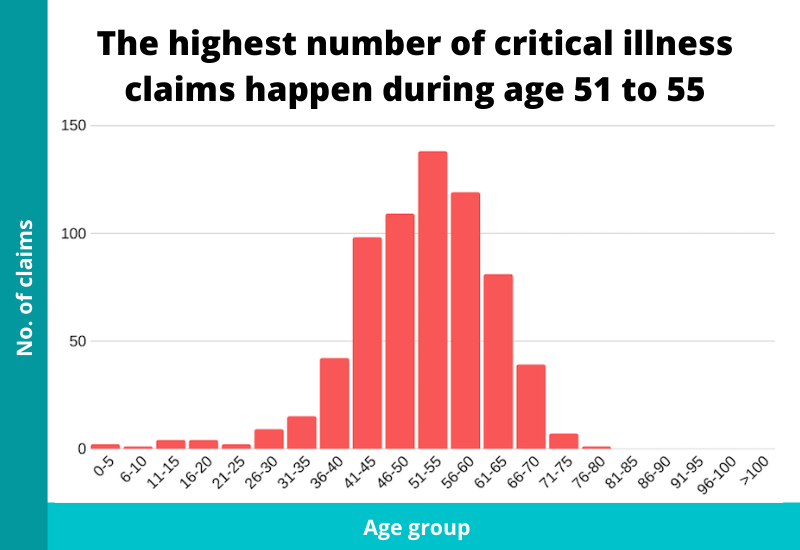
| Age | No. of Claims |
| 0-5 | 2 |
| 6-10 | 1 |
| 11-15 | 4 |
| 16-20 | 4 |
| 21-25 | 2 |
| 26-30 | 9 |
| 31-35 | 15 |
| 36-40 | 42 |
| 41-45 | 98 |
| 46-50 | 109 |
| 51-55 | 138 |
| 56-60 | 119 |
| 61-65 | 81 |
| 66-70 | 39 |
| 71-75 | 7 |
| 76-80 | 1 |
| 81-85 | 0 |
| 86-90 | 0 |
| 91-95 | 0 |
| 96-100 | 0 |
| >100 | 0 |
KEY TAKEAWAY
The majority of CI claims happen at an earlier age as compared to that of death (61 to 65). Also, a large percentage of CI claims are from age 41 to 65.
18) Cancer is the cause for 73.17% of all CI claims
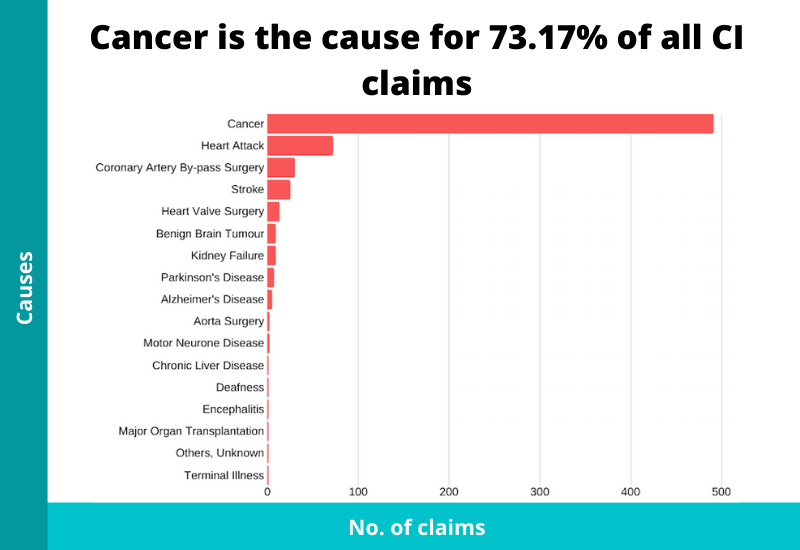
| Cause | No. of Claims |
| Cancer | 491 |
| Heart Attack | 72 |
| Coronary Artery By-pass Surgery | 30 |
| Stroke | 25 |
| Heart Valve Surgery | 13 |
| Benign Brain Tumour | 9 |
| Kidney Failure | 9 |
| Parkinson’s Disease | 7 |
| Alzheimer’s Disease | 5 |
| Aorta Surgery | 2 |
| Motor Neurone Disease | 2 |
| Chronic Liver Disease | 1 |
| Deafness | 1 |
| Encephalitis | 1 |
| Major Organ Transplantation | 1 |
| Others, Unknown | 1 |
| Terminal Illness | 1 |
Of all the CI claims (671), 491 is due to cancer. This means that cancer represented 73.17% of all CI claims, and is the number one cause of it.
KEY TAKEAWAY
As usual, cancer is the main culprit for CI claims. The numbers shown here are in line with what Life Insurance Association has stated that more than 90% of all CI claims come from cancer, heart attack, stroke, kidney failure, and coronary artery by-pass surgery. In our data, 93.45% (627/671) of the CI claims are from only those five.
19) The highest number of CI claims due to cancer happen from age 51 to 55
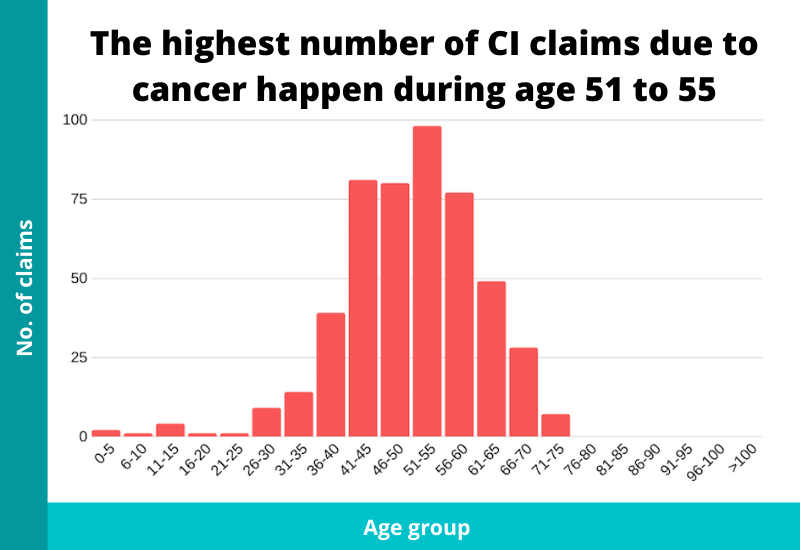
| Age | No. of Claims |
| 0-5 | 2 |
| 6-10 | 1 |
| 11-15 | 4 |
| 16-20 | 1 |
| 21-25 | 1 |
| 26-30 | 9 |
| 31-35 | 14 |
| 36-40 | 39 |
| 41-45 | 81 |
| 46-50 | 80 |
| 51-55 | 98 |
| 56-60 | 77 |
| 61-65 | 49 |
| 66-70 | 28 |
| 71-75 | 7 |
| 76-80 | 0 |
| 81-85 | 0 |
| 86-90 | 0 |
| 91-95 | 0 |
| 96-100 | 0 |
| >100 | 0 |
KEY TAKEAWAY
Just breaking down the most important cause of CI claims – cancer. By now, you would’ve realised by now that critical illness, especially cancer, is something that you need to be aware of. Cancer is the top cause not just for CI claims, but for death claims as well. So that’s why the probability of death happening after contracting cancer is much greater than any other causes.
20) The majority of CI claims happen from $100,000 to $199,999
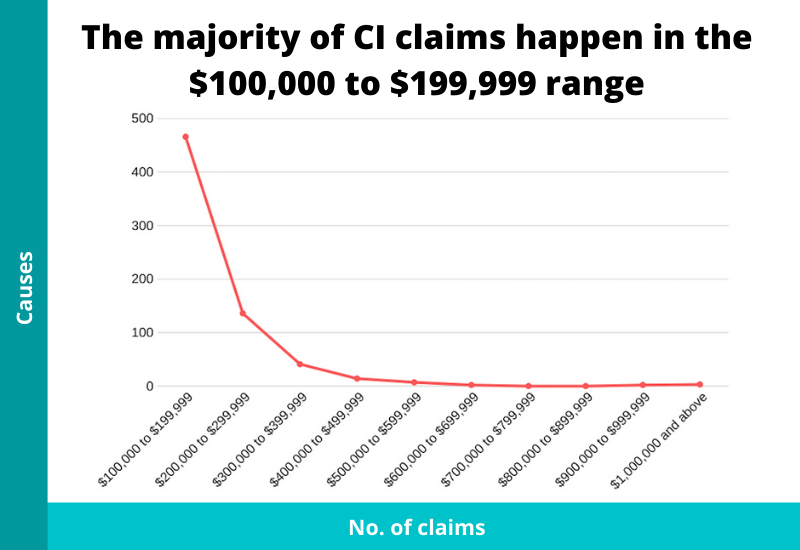
| Amount Claimed | No. of Claims |
| $100,000 to $199,999 | 466 |
| $200,000 to $299,999 | 136 |
| $300,000 to $399,999 | 41 |
| $400,000 to $499,999 | 14 |
| $500,000 to $599,999 | 7 |
| $600,000 to $699,999 | 2 |
| $700,000 to $799,999 | 0 |
| $800,000 to $899,999 | 0 |
| $900,000 to $999,999 | 2 |
| $1,000,000 and above | 3 |
KEY TAKEAWAY
As usual, the range of claimed amounts is similar to death and TPD. One thing to note here is that you may not need the same coverage for death or TPD as if one were to contract CI, he either recovers or the worst happens after five years (general rule of thumb).
Conclusion
And there you have it.
Hopefully, this has given you valuable insights into life insurance claim statistics in Singapore.
Nobody ever wants to make an insurance claim. But the real reason we buy insurance is to ensure that when misfortune strikes, the payouts can help support us and our loved ones.
So, the real question is: “Am I sufficiently covered right now?”
Answering it properly means looking at every layer, from the national schemes you already hold to the private cover sitting on top. The full planning sequence walks through it in order.
Feel free to use our life insurance coverage calculator to estimate how much coverage you need.
BEFORE YOU GO
Articles can tell you what generally makes sense. They can't see your policies, your CPF, or your plans.
FullCircle is our comprehensive financial planning session. A licensed consultant goes through what you have, shows you the gaps and overlaps, and tells you what to prioritise across protection, retirement, and estate planning.
It's complimentary, takes about 45 minutes, and if nothing needs changing, we'll say so.