We have previously written about the average income/salary in Singapore, breaking it down by age, sex, education, occupation, and industry.
Given the recent months’ inflation and rising cost of living pressures on both single and dual-income households, we will explore household income, its significance, as well as the average and median household income in Singapore.
Moreover, with income arguably the most vital element in financial planning, we investigate income trends over the years and the income distribution in Singapore.
So, if you wish to compare your household income with others, you should read on!
All figures are in Singapore dollars unless otherwise specified. An exchange rate of US$1 to S$1.35 was used for conversions.
Summary of Key Findings
- The average median household income (inclusive of employer CPF contributions) was $10,869 per month. This is equivalent to US$8,051/month (or US$96,612/year)
- The average mean household monthly income (inclusive of employer CPF contributions) was $13,958
- The average median household income (excluding employer CPF contributions) was $9,646 per month
- The percentage of households earning $8,000 and above increased from 51.1% to 55.7% over the past 2 years
- The bottom 10% of households earned $2,336 monthly, while the top 10% earned $32,901 monthly
- The median monthly household income per household member has increased by 55.8% over the past 10 years
Read on for more details.
SIDE NOTE

When was the last time you conducted thorough financial planning or reviewed your finances?

In this day and age in Singapore, doing so will absolutely improve the quality of life for you and your loved ones.

Here are 5 reasons why financial planning is so important.
The Source of Our Data
What is household income? Household income can be defined as the sum of the gross income of all the members of a household obtained from employment or business dealings.
As for data on household income, we only looked at the most reliable data available, and that comes from the Singapore Department of Statistics. The department publishes comprehensive data on household income yearly. As of 20 Feb 2024, the latest published data was on 7 Feb 2024.
The data looks into both resident households and resident employed households, where the household reference person is either a Singapore citizen or a permanent resident. The main difference is that resident employed households have a minimum of one employed person. We will indicate whether the datasets consist of all resident households or just resident employed households.
The Difference Between Mean and Median Household Income
Simply put, the mean household income is the average income per household. This value addresses the question: “If income would be equally distributed to all households, how much would each household earn?”
However, the mean value does not showcase the underlying income inequality in a given set of household incomes.
Median household income refers to the income level at the midpoint of all households ranked according to their income. The median value refers to the income amount that divides the population of a given data set into two groups, with one group having an income above that amount and the other having an income less than that stated amount.
Thus, compared to the mean household income figure, the median household income value is a more useful way to accurately reflect the income distribution of a given population.
5 Household Income Statistics in Singapore [2024]
Here are some noteworthy facts and statistics that we have found.
1) The average median household income was $10,869 per month
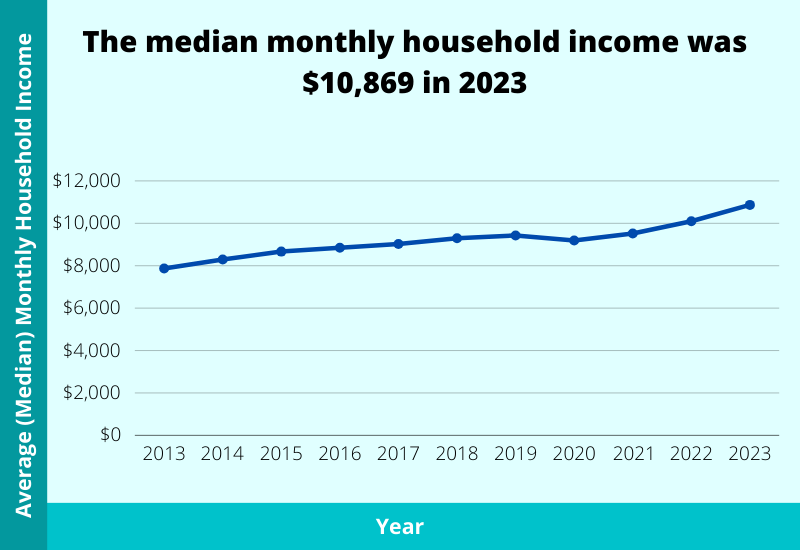
Among resident employed households in Singapore, the median monthly household income from work rose by 7.6% in nominal terms, from $10,099 in 2022 to $10,869 in 2023.
After taking inflation into account, Singapore’s median monthly household income from work increased by 2.8% in real terms in 2023.
In contrast, the median monthly household income in Singapore a decade ago (2013) saw a figure of $7,872, which has since increased by 38.1%.

| Year | Median Household Monthly Income (Including Employer CPF Contributions) |
| 2023 | $10,869 |
| 2022 | $10,099 |
| 2021 | $9,520 |
| 2020 | $9,189 |
| 2019 | $9,425 |
| 2018 | $9,293 |
| 2017 | $9,023 |
| 2016 | $8,846 |
| 2015 | $8,666 |
| 2014 | $8,292 |
| 2013 | $7,872 |
| 2012 | $7,566 |
Additionally, the average mean household monthly income in Singapore was $13,958 in 2023 (taking into account CPF contributions from employers).
Nonetheless, excluding employer CPF contributions, the figures are as follows.
| Year | Median Household Monthly Income (Excluding Employer CPF Contributions) |
| 2023 | $9,646 |
| 2022 | $8,904 |
| 2021 | $8,421 |
| 2020 | $8,092 |
| 2019 | $8,333 |
| 2018 | $8,169 |
| 2017 | $7,956 |
| 2016 | $7,791 |
| 2015 | $7,624 |
| 2014 | $7,400 |
| 2013 | $7,000 |
| 2012 | $6,712 |
2023 witnessed an average median household monthly income figure of $9,646, compared with $8,904 in 2022 as well as $7,000 in 2013.
DID YOU KNOW?

According to a survey conducted by MoneySense, about 3 out of 10 Singapore residents aged 30 to 59 had not started planning for their future financial needs.

This isn't surprising because personal finance can seem complicated and daunting. But really, there are only a few things that you should focus on.

Learn how to significantly improve your personal finances with the 7-step "wedding cake" strategy today.
2) Households earning $8,000 and above increased from 51.1% to 55.7% over the past 2 years
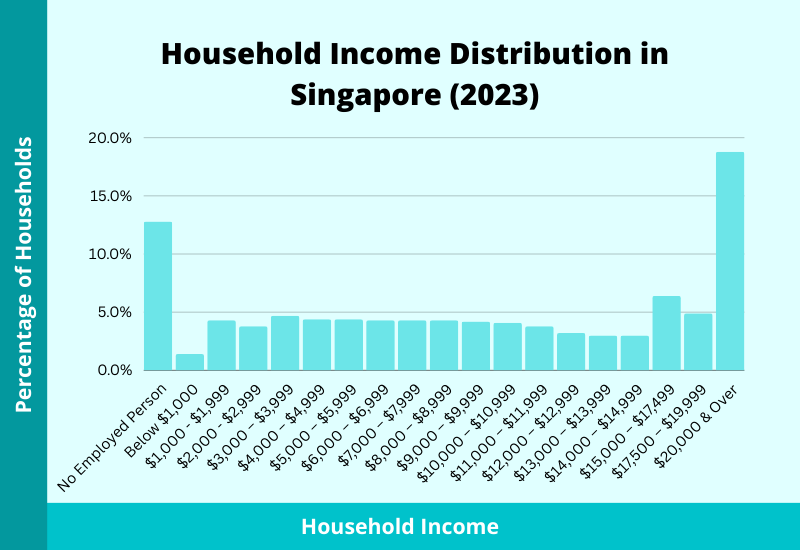
Over the past 2 years (2021 to 2023), among all resident households, we saw an increase in the percentage of households earning $8,000 and above, from 51.1% to 55.7%.
There was a noticeable rise in households earning $20,000 and above, from 14.4% to 18.8%.
The percentage of households with no employed persons has slightly increased over the past 2 years, from 11.8% to 12.8%.
Also, the percentage of households earning from below $1,000 to $7,999 has fallen.

| Monthly Household Income (Including Employer CPF Contributions) | |||
| 2023 (%) | 2022 (%) | 2021 (%) | |
| Total | 100 | 100 | 100 |
| No Employed Person | 12.8 | 12.5 | 11.8 |
| – Solely Non-Employed Persons Aged 65 Years & Over | 8 | 7.6 | 7.1 |
| Below $1,000 | 1.4 | 1.3 | 2 |
| $1,000 – $1,999 | 4.3 | 4.4 | 5 |
| $2,000 – $2,999 | 3.8 | 4.4 | 4.8 |
| $3,000 – $3,999 | 4.7 | 5.2 | 5.7 |
| $4,000 – $4,999 | 4.4 | 5 | 5 |
| $5,000 – $5,999 | 4.4 | 5 | 5.1 |
| $6,000 – $6,999 | 4.3 | 4.6 | 4.8 |
| $7,000 – $7,999 | 4.3 | 4.6 | 4.7 |
| $8,000 – $8,999 | 4.3 | 4.6 | 4.7 |
| $9,000 – $9,999 | 4.2 | 4 | 4.4 |
| $10,000 – $10,999 | 4.1 | 4.1 | 4.1 |
| $11,000 – $11,999 | 3.8 | 3.7 | 3.5 |
| $12,000 – $12,999 | 3.2 | 3.3 | 3.4 |
| $13,000 – $13,999 | 3 | 3.1 | 3.1 |
| $14,000 – $14,999 | 3 | 2.7 | 2.8 |
| $15,000 – $17,499 | 6.4 | 6.1 | 5.9 |
| $17,500 – $19,999 | 4.9 | 4.4 | 4.8 |
| $20,000 & Over | 18.8 | 16.9 | 14.4 |
3) The bottom 10% of households earned $2,336 monthly, while the top 10% earned $32,901 monthly
In 2023, the average monthly household income from work (with employer CPF contributions) was $2,336 for the bottom 10% of households in Singapore, whereas the top 10% of households earned $32,901 monthly.
| Average Monthly Household Income (Including Employer CPF Contributions) | |
| Total (average mean) | $13,958 |
| 1st (Lowest) | $2,336 |
| 2nd | $4,918 |
| 3rd | $7,026 |
| 4th | $9,289 |
| 5th | $11,228 |
| 6th | $13,624 |
| 7th | $15,939 |
| 8th | $19,296 |
| 9th | $23,024 |
| 10th (Highest) | $32,901 |
4) The median monthly household income per household member has increased by 55.8% over the past 10 years
Reflecting only figures from resident employed households, the median monthly household income per household member has risen by 55.8% over the past decade.
In 2023, the median monthly household income per household member was $3,500, as compared to $3,287 in 2022 and $2,247 in 2013.
| Median Monthly Household Income Per Household Member (Including Employer CPF Contributions) | |
| 2023 | $3,500 |
| 2022 | $3,287 |
| 2021 | $3,027 |
| 2020 | $2,886 |
| 2019 | $2,925 |
| 2018 | $2,792 |
| 2017 | $2,699 |
| 2016 | $2,584 |
| 2015 | $2,500 |
| 2014 | $2,380 |
| 2013 | $2,247 |
| 2012 | $2,127 |
When studying these figures, one should consider factors like household size and larger households typically require more financial resources. What is more, with dropping fertility rates over the years, one may speculate if the increase in income per household member is attributable to fewer household members or an increase in individual incomes.
5) Household members in smaller homes received $13,623 in government transfers in 2023
Household members in smaller homes (residents living in HDB 1- and 2-room flats) received $13,623 in government transfers in 2023. This figure was the highest amongst the amounts received by residents in all dwellings.
In addition, 2023’s figure was an increase of 8.7% from 2022. This figure was even higher than the government transfers in 2020 when more aid was given out due to the debilitating economic effects of the COVID-19-induced global economic standstill.
| Year | Total | HDB 1- & 2- Room Flats | HDB 3-Room Flats | HDB 4-Room Flats | HDB 5-Room & Executive Flats | Condominiums & Other Apartments | Landed Properties |
| 2023 | 6,371 | 13,623 | 7,089 | 6,317 | 6,163 | 3,777 | 4,015 |
| 2022 | 5,859 | 12,379 | 6,568 | 5,760 | 5,650 | 3,649 | 3,794 |
| 2021 | 5,252 | 11,521 | 5,576 | 5,159 | 5,045 | 3,391 | 3,611 |
| 2020 | 6,318 | 13,819 | 7,251 | 6,265 | 6,001 | 3,671 | 3,732 |
| 2019 | 4,672 | 10,678 | 4,846 | 4,537 | 4,608 | 3,017 | 3,177 |
| 2018 | 4,547 | 10,544 | 4,683 | 4,410 | 4,486 | 2,930 | 3,148 |
| 2017 | 4,502 | 10,428 | 4,502 | 4,394 | 4,423 | 3,048 | 3,333 |
| 2016 | 4,252 | 10,069 | 4,258 | 4,131 | 4,238 | 2,712 | 2,909 |
| 2015 | 4,099 | 9,486 | 3,857 | 3,909 | 4,235 | 2,889 | 3,096 |
| 2014 | 3,528 | 9,326 | 3,388 | 3,403 | 3,555 | 2,177 | 2,488 |
| 2013 | 3,671 | 8,845 | 3,398 | 3,487 | 3,770 | 2,701 | 2,771 |
Evidently, as with other countries, income/wealth inequality may still exist in Singapore. Fortunately, more efforts have been dedicated to addressing the needs of residents staying in smaller homes and/or coming from lower-income families amid soaring prices and other economic challenges.
What’s Next?
Income plays a significant role in each individual’s financial planning journey. Your financial problems could be alleviated if you increase your income. Nonetheless, apart from striving to increase your income, having proper expense management, setting aside sufficient emergency funds, and making use of investments can also indirectly boost your usable income.
Last, but not least, it is also imperative for you to have proper insurance coverage to safeguard your income and wealth. If you still do not have a proper insurance plan in place, or if you are looking to expand your insurance coverage, consult with us here for a comprehensive financial planning consultation aimed at protecting your income and providing for your loved ones


