We have previously written about the average income/salary in Singapore, breaking it down by age, sex, education, occupation, and industry.
Given the recent months’ inflation and rising cost of living pressures on both single and dual-income households, we will explore household income, its significance, as well as the average and median household income in Singapore.
Moreover, since income is arguably the most vital element in financial planning — and protecting it through insurance is equally important — we investigate income trends over the years and the income distribution in Singapore.
So, if you wish to compare your household income with others, you should read on!
All figures are in Singapore dollars unless otherwise specified. An exchange rate of US$1 to S$1.30 was used for conversions.
Summary of Key Findings
- The median household income (or household market income) was $12,446 per month. This is equivalent to US$9,573/month (or US$114,876/year).
- The median household employment income (inclusive of employer CPF contributions) was $12,027 per month. This is equivalent to US$9,251/month (or US$111,012/year).
- The median household employment income (excluding employer CPF contributions) was $10,591 per month.
- The percentage of households earning $8,000 and above in household market income increased from 62.3% to 65.7% over the past 2 years.
- The bottom 10% of households had a monthly market income of $1,196, while the top 10% had $40,304.
Read on for more details.
SIDE NOTE
A policy bought years ago. Savings in three places. A will that's still on the to-do list.
None of it is wrong. It's just not a plan yet.
There's an order that turns the pieces into one system, and it doesn't require becoming a finance expert. Here's the order, in 7 steps, so you know what to sort out first.
The Source of Our Data
What is household income? Broadly speaking, household income is the sum of gross income received by all members of a household.
The New Standard: Household Market Income
For the most reliable data, we look to the Singapore Department of Statistics and its annual “Key Household Income Trends” (KHIT) report. The latest release on 9 February 2026 marks a significant shift in methodology.
In prior editions, the data focused primarily on Employment Income, which is money earned from work (including employer CPF contributions) or self-employment. This meant the statistics often excluded households with no employed persons, such as retirees.
Starting with the KHIT 2025 report, the Department of Statistics has adopted a more comprehensive standard called Household Market Income. This new series covers all resident households, including those without employed members. By definition, “resident households” refers to households headed by a Singapore citizen or permanent resident.
Components of Household Market Income
Under this new definition, Household Market Income is the sum of two main components:
- Employment Income: This includes wages, salaries, and self-employment income, as well as employer CPF contributions.
- Non-Employment Income: This newly added category captures income from private sources where no work is performed. It includes:
- Investment Income: Dividends from securities (e.g., shares, bonds) and interest from savings, fixed deposits, and CPF accounts.
- Rental Income: Revenue from renting out residential properties.
- Annuities: Payouts from private insurers, CPF LIFE, or the Retirement Sum Scheme.
- Pensions & Royalties: Standard pension payouts and royalty fees.
- Insurance Payouts: Regular payouts from CareShield Life or ElderShield.
- Transfers from Other Households: Allowances, such as those from children not living with parents, and alimony.
For the purpose of clarity and to adhere to this new methodology, we will be using the terms “Household Income” and “Household Market Income” interchangeably throughout this article.
The Difference Between Mean and Median Household Income
Simply put, the mean household income is the average income per household. This figure addresses the question: “If total income were distributed equally among all households, how much would each receive?”
However, the mean can be misleading because it does not account for income inequality. It is often skewed upward by a small number of high earners, which can make the average household appear wealthier than they actually are.
In contrast, the median household income identifies the exact midpoint of all households when ranked from lowest to highest income. This value divides the population into two equal groups: the lower half earns less than this amount, and the upper half earns more.
Consequently, the median is generally preferred over the mean because it is not distorted by extreme outliers. This makes it a more accurate reflection of the income distribution for the typical household.
7 Household Income Statistics in Singapore [2026]
Here are some noteworthy facts and statistics that we have found.
1) The average (median) household income was $12,446 per month
In 2025, the median monthly household market income reached $12,446, reflecting a 7.7% nominal increase from $11,558 in 2024. After adjusting for inflation, this translates to a 6.8% growth in real terms.
This continues a decade-long upward trend: since 2015, when the median stood at $8,839, household income has risen by 40.8%.
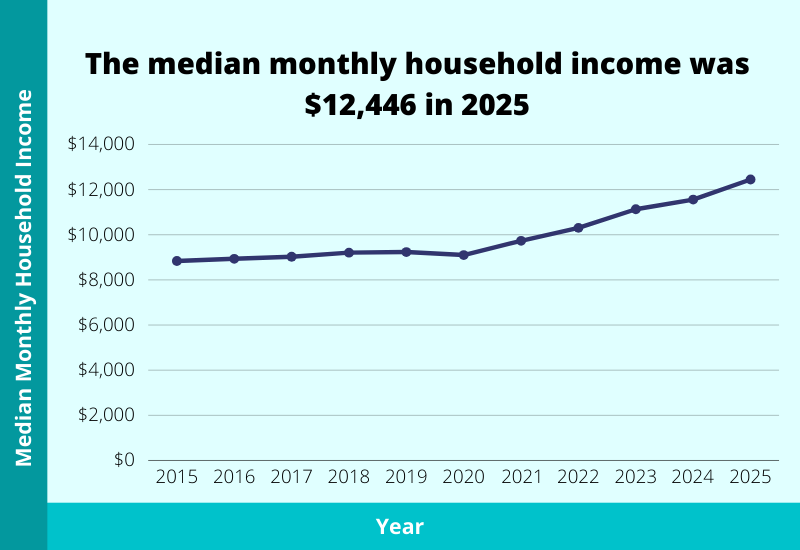
| Year | Median Monthly Household Market Income |
|---|---|
| 2025 | $12,446 |
| 2024 | $11,558 |
| 2023 | $11,130 |
| 2022 | $10,305 |
| 2021 | $9,731 |
| 2020 | $9,099 |
| 2019 | $9,232 |
| 2018 | $9,207 |
| 2017 | $9,027 |
| 2016 | $8,934 |
| 2015 | $8,839 |
To add more context, the average monthly household market income was $16,159 in 2025.
QUICK CHECK
Can you answer these three questions?
1) If something happened to you tomorrow, how much would your family receive?
2) At 65, what monthly income will your savings and investments pay you?
3) If you never get round to a will, who inherits what, and in what proportion?
Most people manage one at best. Not because they're careless, but because nobody has shown them which order to tackle things in.
That order exists. Work through your finances in this sequence, from income and protection through to investments and estate planning.
2) The median monthly household income per household member has increased by 58.9% over the past 10 years
The median monthly household income per member reached $4,160 in 2025, up from $3,837 the previous year. This represents a 58.9% increase compared to the $2,618 recorded a decade ago in 2015.
| Year | Median Monthly Household Market Income Per Household Member |
|---|---|
| 2025 | $4,160 |
| 2024 | $3,837 |
| 2023 | $3,699 |
| 2022 | $3,460 |
| 2021 | $3,202 |
| 2020 | $2,952 |
| 2019 | $2,971 |
| 2018 | $2,851 |
| 2017 | $2,755 |
| 2016 | $2,674 |
| 2015 | $2,618 |
When studying these figures, one should consider factors like household size and larger households typically require more financial resources. Furthermore, with dropping fertility rates over the years, one may speculate if the increase in income per household member is attributable to fewer household members or an increase in individual incomes.
3) The average (median) household employment income was $12,027 per month
Among resident employed households in Singapore, the median monthly household income from work rose by 6.3% in nominal terms, from $11,314 in 2024 to $12,027 in 2025.
After taking inflation into account, Singapore’s median monthly household income from work increased by 5.4% in real terms in 2025.
In contrast, the median monthly household employment income in Singapore a decade ago (2015) stood at $8,673, which has since increased by 38.7%.
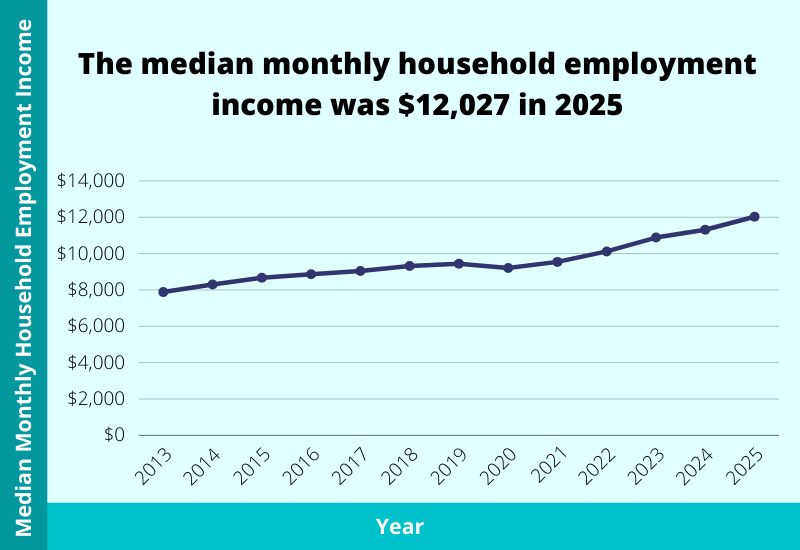
| Year | Median Monthly Household Employment Income (Including Employer CPF Contributions) |
|---|---|
| 2025 | $12,027 |
| 2024 | $11,314 |
| 2023 | $10,882 |
| 2022 | $10,120 |
| 2021 | $9,544 |
| 2020 | $9,208 |
| 2019 | $9,442 |
| 2018 | $9,315 |
| 2017 | $9,044 |
| 2016 | $8,867 |
| 2015 | $8,673 |
Additionally, the average (mean) monthly household employment income in Singapore was $15,205 in 2025 (taking into account CPF contributions from employers).
Excluding employer CPF contributions, the figures are as follows.
| Year | Median Monthly Household Employment Income (Excluding Employer CPF Contributions) |
|---|---|
| 2025 | $10,591 |
| 2024 | $9,999 |
| 2023 | $9,646 |
| 2022 | $8,904 |
| 2021 | $8,421 |
| 2020 | $8,092 |
| 2019 | $8,333 |
| 2018 | $8,169 |
| 2017 | $7,956 |
| 2016 | $7,791 |
| 2015 | $7,624 |
In 2025, the median monthly household employment income reached $10,591 (excluding employer CPF contributions), up from $9,999 the previous year.
Notably, the mean household employment income of $13,752 remains considerably higher than the median.
4) The median monthly household employment income per household member has increased by 56.2% over the past 10 years
The median monthly household employment income per member for resident employed households reached $3,909 in 2025, up from $3,621 the previous year. This represents a robust 56.2% increase compared to the $2,503 recorded a decade ago in 2015.
| Year | Median Monthly Household Employment Income Per Household Member (Including Employer CPF Contributions) |
|---|---|
| 2025 | $3,909 |
| 2024 | $3,621 |
| 2023 | $3,507 |
| 2022 | $3,291 |
| 2021 | $3,033 |
| 2020 | $2,891 |
| 2019 | $2,930 |
| 2018 | $2,799 |
| 2017 | $2,706 |
| 2016 | $2,591 |
| 2015 | $2,503 |
5) Households with market income of $8,000 and above increased from 62.3% to 65.7%
Between 2023 and 2025, resident households saw a broad upward shift in income. The proportion of households with a monthly market income of $8,000 or more grew from 62.3% to 65.7%.
The rise was even more pronounced at the higher end, where households with $20,000 or more in monthly income increased from 23.9% to 28.7%. As a result, the share of lower-income households (below $8,000) has correspondingly fallen.
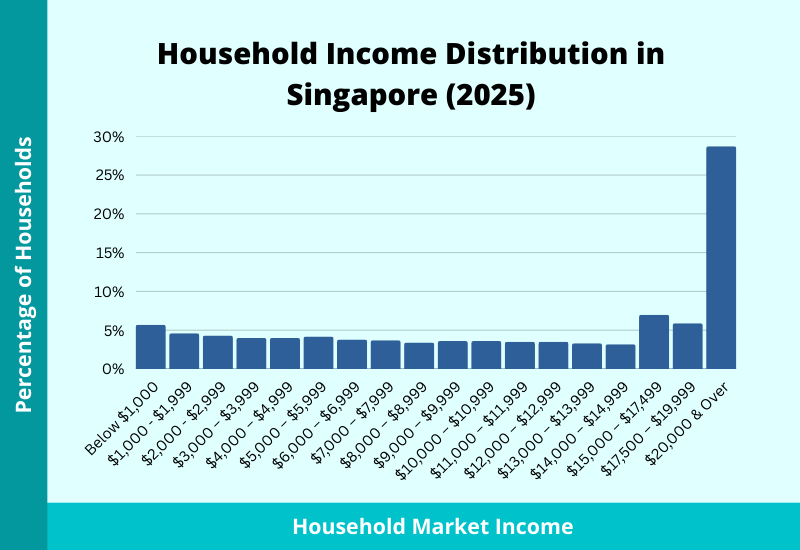
| Monthly Household Market Income | 2025 (%) | 2024 (%) | 2023 (%) |
|---|---|---|---|
| Total | 100 | 100 | 100 |
| Below $1,000 | 5.7 | 6.2 | 6.5 |
| $1,000 – $1,999 | 4.6 | 4.6 | 4.5 |
| $2,000 – $2,999 | 4.3 | 4.8 | 4.6 |
| $3,000 – $3,999 | 4 | 4.4 | 4.6 |
| $4,000 – $4,999 | 4 | 4.3 | 4.5 |
| $5,000 – $5,999 | 4.2 | 3.9 | 4.5 |
| $6,000 – $6,999 | 3.8 | 4.2 | 4.2 |
| $7,000 – $7,999 | 3.7 | 4 | 4.2 |
| $8,000 – $8,999 | 3.4 | 4 | 4 |
| $9,000 – $9,999 | 3.6 | 3.6 | 3.9 |
| $10,000 – $10,999 | 3.6 | 3.8 | 4 |
| $11,000 – $11,999 | 3.5 | 3.7 | 3.6 |
| $12,000 – $12,999 | 3.5 | 3.6 | 3.5 |
| $13,000 – $13,999 | 3.3 | 3.6 | 3.6 |
| $14,000 – $14,999 | 3.2 | 3 | 3 |
| $15,000 – $17,499 | 7 | 6.7 | 7.1 |
| $17,500 – $19,999 | 5.9 | 5.7 | 5.7 |
| $20,000 & Over | 28.7 | 25.8 | 23.9 |
6) The bottom 10% of households had a monthly market income of $1,196, while the top 10% had $40,304
In 2025, the average monthly household market income among resident households was $1,196 for the bottom 10% of households in Singapore, whereas the top 10% of households received $40,304 monthly.
| Deciles | Average Monthly Household Market Income |
|---|---|
| Total (mean) | $16,159 |
| 1st (Lowest) | $1,196 |
| 2nd | $4,417 |
| 3rd | $7,436 |
| 4th | $9,868 |
| 5th | $12,758 |
| 6th | $15,771 |
| 7th | $19,022 |
| 8th | $22,920 |
| 9th | $27,896 |
| 10th (Highest) | $40,304 |
7) Household members in smaller homes received $16,519 in government transfers in 2025
Household members in smaller homes (residents living in HDB 1- and 2-room flats) received $16,519 in government transfers in 2025. This figure was the highest among all dwelling types.
The total average for all housing types declined by 5.5% compared to 2024, largely reflecting the phase-out of temporary relief measures and one-off schemes.
| Year | Total | HDB 1- & 2- Room Flats | HDB 3-Room Flats | HDB 4-Room Flats | HDB 5-Room & Executive Flats | Condominiums & Other Apartments | Landed Properties |
|---|---|---|---|---|---|---|---|
| 2025 | 7,300 | 16,519 | 8,383 | 7,179 | 6,814 | 4,173 | 4,348 |
| 2024 | 7,725 | 17,075 | 9,000 | 7,666 | 7,299 | 4,230 | 4,633 |
| 2023 | 6,269 | 13,856 | 7,062 | 6,216 | 5,968 | 3,595 | 3,877 |
| 2022 | 5,752 | 12,346 | 6,477 | 5,645 | 5,518 | 3,536 | 3,719 |
| 2021 | 5,181 | 11,490 | 5,546 | 5,077 | 4,962 | 3,303 | 3,524 |
| 2020 | 6,240 | 13,752 | 7,199 | 6,183 | 5,907 | 3,587 | 3,664 |
| 2019 | 4,528 | 10,577 | 4,737 | 4,397 | 4,447 | 2,834 | 3,032 |
| 2018 | 4,458 | 10,453 | 4,615 | 4,324 | 4,382 | 2,826 | 3,073 |
| 2017 | 4,337 | 10,342 | 4,396 | 4,252 | 4,242 | 2,782 | 3,118 |
| 2016 | 4,173 | 9,993 | 4,202 | 4,053 | 4,141 | 2,632 | 2,819 |
| 2015 | 3,866 | 9,415 | 3,708 | 3,719 | 3,975 | 2,469 | 2,765 |
Evidently, as with other countries, income/wealth inequality may still exist in Singapore. Fortunately, more efforts have been dedicated to addressing the needs of residents staying in smaller homes and/or coming from lower-income families amid soaring prices and other economic challenges.
What’s Next?
Income plays a significant role in each individual’s financial planning journey. Your financial problems could be alleviated if you increase your income. Nonetheless, apart from striving to increase your income, having proper expense management, setting aside sufficient emergency funds, and making use of investments can also indirectly boost your usable income.
Last, but not least, it is also imperative for you to have proper insurance coverage to safeguard your income and wealth. If you still do not have a proper insurance plan in place, or if you are looking to expand your insurance coverage, consult with us here for a comprehensive financial planning consultation aimed at protecting your income and providing for your loved ones.
BEFORE YOU GO
Articles can tell you what generally makes sense. They can't see your policies, your CPF, or your plans.
FullCircle is our comprehensive financial planning session. A licensed consultant goes through what you have, shows you the gaps and overlaps, and tells you what to prioritise across protection, retirement, and estate planning.
It's complimentary, takes about 45 minutes, and if nothing needs changing, we'll say so.