

We have previously written about the average income/salary in Singapore, breaking it down by age, sex, education, occupation, and industry.
This time we are looking at the household as a whole. With inflation and the cost of living squeezing both single and dual-income households, the household figure is usually the one that tells you where you actually stand.
Income is the foundation of most financial plans, and protecting it matters just as much as growing it. So below, we cover the latest median and average figures, how income has moved over the years, and how it is spread across households.
If you want to see where your household sits, read on.
All figures are in Singapore dollars unless otherwise specified. An exchange rate of US$1 to S$1.30 (as of early 2026) was used for conversions.
Summary of Key Findings
- The median household income (or household market income) was $12,446 per month. This is equivalent to US$9,573/month (or US$114,876/year).
- The median household employment income (inclusive of employer CPF contributions) was $12,027 per month. This is equivalent to US$9,251/month (or US$111,012/year).
- The median household employment income (excluding employer CPF contributions) was $10,591 per month.
- The percentage of households earning $8,000 and above in household market income increased from 62.3% to 65.7% over the past 2 years.
- The bottom 10% of households had a monthly market income of $1,196, while the top 10% had $40,304.
- 13.4% of households earned $30,000 or more a month in 2025, almost double the 7.4% share in 2020.
- 56.6% of married couples were dual-income households in 2025, up from 52.5% in 2020.
Read on for more details.
SIDE NOTE
A policy bought years ago. Savings in three places. A will that's still on the to-do list.
None of it is wrong. It's just not a plan yet.
There's an order that turns the pieces into one system, and it doesn't require becoming a finance expert. Here's the order, in 7 steps, so you know what to sort out first.
The Source of Our Data
What is household income? It’s the combined gross income of everyone living in the same home.
The new standard: household market income
For the most reliable data, we look to the Singapore Department of Statistics and its annual Key Household Income Trends (KHIT) report. The latest release, on 9 February 2026, changed how the headline number is measured.
Earlier editions focused on Employment Income, which is money earned from work (including employer CPF contributions) or self-employment. Households with nobody employed, retirees in particular, were left out of the headline figures.
From the KHIT 2025 report onwards, the Department of Statistics uses a broader measure called Household Market Income, which covers all resident households, including those with no working members. “Resident households” here means households headed by a Singapore citizen or permanent resident.
Components of household market income
Household Market Income adds up two things.
The first is employment income: wages, salaries, self-employment income, and employer CPF contributions.
The second is non-employment income, the newly added part. This is money coming in without anyone working for it:
- Dividends from shares and other investments, and interest from savings, fixed deposits, and CPF balances
- Rental income from property
- Annuity payouts from private insurers, CPF LIFE, or the Retirement Sum Scheme
- Pensions and royalties
- Regular payouts from CareShield Life or ElderShield
- Money from other households, such as allowances from children living elsewhere, and alimony
For simplicity, we use “household income” and “household market income” to mean the same thing throughout this article.
The Difference Between Mean and Median Household Income
The mean is the plain average: total income divided by the number of households. It answers the question, “if every household earned the same amount, what would that amount be?”
The problem is that a small group of very high earners pulls the mean upwards, which makes the typical household look richer than it is.
The median is the middle household once you line them all up from lowest to highest. Half earn less, half earn more.
That’s why we lead with the median. It isn’t thrown off by the extremes at the top, so it describes the typical household far better.
9 Household Income Statistics in Singapore [2026]
Here’s what the latest data shows.
1) The average (median) household income was $12,446 per month
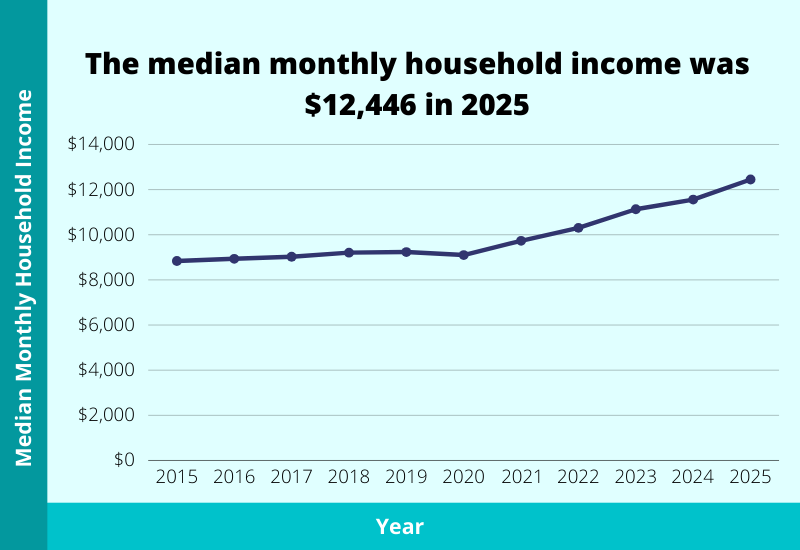
The median monthly household market income was $12,446 in 2025, up 7.7% from $11,558 in 2024. Strip out inflation and that’s still 6.8% real growth.
Zoom out and the trend holds. The median was $8,839 in 2015, so household income has grown 40.8% over the decade. Most of that came in the second half. Real median income rose 17.0% from 2020 to 2025, or 3.2% a year, against 2.2% over the whole five years before that.
| Year | Median Monthly Household Market Income |
|---|---|
| 2025 | $12,446 |
| 2024 | $11,558 |
| 2023 | $11,130 |
| 2022 | $10,305 |
| 2021 | $9,731 |
| 2020 | $9,099 |
| 2019 | $9,232 |
| 2018 | $9,207 |
| 2017 | $9,027 |
| 2016 | $8,934 |
| 2015 | $8,839 |
For comparison, the average (mean) monthly household market income was $16,159 in 2025, well above the median.
2) The median monthly household income per household member has increased by 58.9% over the past 10 years
Median monthly household income per member was $4,160 in 2025, up from $3,837 the year before, and 58.9% higher than the $2,618 recorded in 2015.
| Year | Median Monthly Household Market Income Per Household Member |
|---|---|
| 2025 | $4,160 |
| 2024 | $3,837 |
| 2023 | $3,699 |
| 2022 | $3,460 |
| 2021 | $3,202 |
| 2020 | $2,952 |
| 2019 | $2,971 |
| 2018 | $2,851 |
| 2017 | $2,755 |
| 2016 | $2,674 |
| 2015 | $2,618 |
Read this one with a bit of caution. Households come in different sizes, and bigger ones need more to go around. With fertility rates falling, part of this rise probably comes from households simply having fewer people in them, not just from everyone earning more.
QUICK CHECK
Can you answer these three questions?
1) If something happened to you tomorrow, how much would your family receive?
2) At 65, what monthly income will your savings and investments pay you?
3) If you never get round to a will, who inherits what, and in what proportion?
Most people manage one at best. Not because they're careless, but because nobody has shown them which order to tackle things in.
That order exists. Work through your finances in this sequence, from income and protection through to investments and estate planning.
3) The average (median) household employment income was $12,027 per month
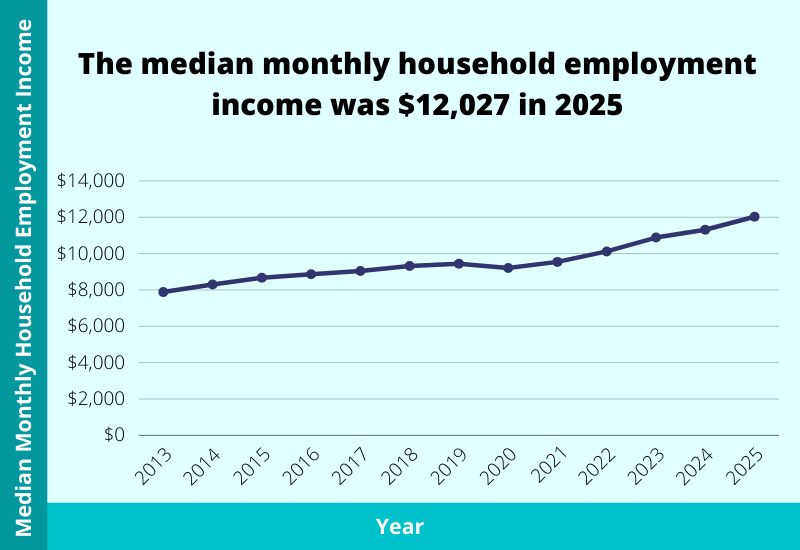
Among resident employed households, median monthly income from work rose 6.3% in nominal terms, from $11,314 in 2024 to $12,027 in 2025. In real terms, after inflation, that’s 5.4%.
Ten years ago, in 2015, the same figure was $8,673. That’s a 38.7% rise over the decade.
| Year | Median Monthly Household Employment Income (Including Employer CPF Contributions) |
|---|---|
| 2025 | $12,027 |
| 2024 | $11,314 |
| 2023 | $10,882 |
| 2022 | $10,120 |
| 2021 | $9,544 |
| 2020 | $9,208 |
| 2019 | $9,442 |
| 2018 | $9,315 |
| 2017 | $9,044 |
| 2016 | $8,867 |
| 2015 | $8,673 |
The average (mean) monthly household employment income was $15,205 in 2025, again including employer CPF contributions.
Here are the same figures with employer CPF contributions stripped out.
| Year | Median Monthly Household Employment Income (Excluding Employer CPF Contributions) |
|---|---|
| 2025 | $10,591 |
| 2024 | $9,999 |
| 2023 | $9,646 |
| 2022 | $8,904 |
| 2021 | $8,421 |
| 2020 | $8,092 |
| 2019 | $8,333 |
| 2018 | $8,169 |
| 2017 | $7,956 |
| 2016 | $7,791 |
| 2015 | $7,624 |
On this basis, the median was $10,591 a month in 2025, up from $9,999 the year before. The mean on the same basis was $13,752, again noticeably higher than the median.
4) The median monthly household employment income per household member has increased by 56.2% over the past 10 years
For resident employed households, median monthly employment income per member was $3,909 in 2025, up from $3,621 the year before, and 56.2% higher than the $2,503 recorded in 2015.
| Year | Median Monthly Household Employment Income Per Household Member (Including Employer CPF Contributions) |
|---|---|
| 2025 | $3,909 |
| 2024 | $3,621 |
| 2023 | $3,507 |
| 2022 | $3,291 |
| 2021 | $3,033 |
| 2020 | $2,891 |
| 2019 | $2,930 |
| 2018 | $2,799 |
| 2017 | $2,706 |
| 2016 | $2,591 |
| 2015 | $2,503 |
5) Households with market income of $8,000 and above increased from 62.3% to 65.7%
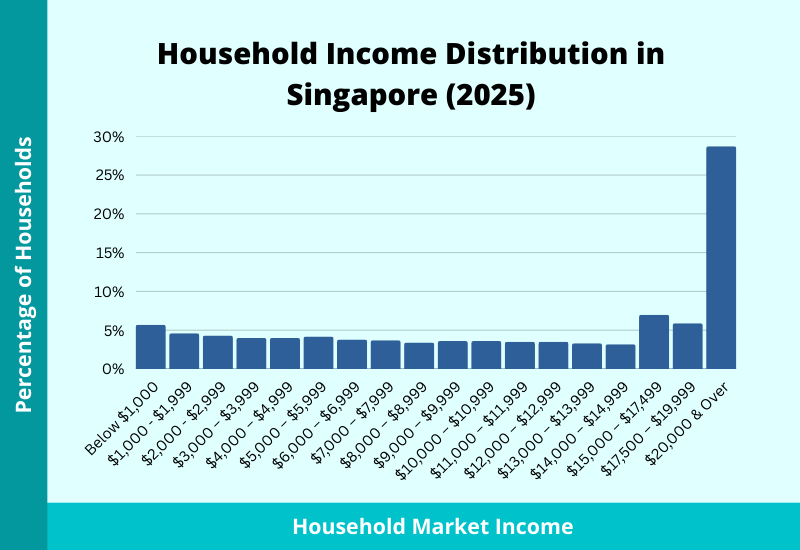
The whole distribution has shifted upwards over the past two years. Households earning $8,000 or more a month went from 62.3% in 2023 to 65.7% in 2025.
The movement was strongest at the top. Households on $20,000 or more grew from 23.9% to 28.7% over the same period, and the share earning below $8,000 shrank accordingly.
| Monthly Household Market Income | 2025 (%) | 2024 (%) | 2023 (%) |
|---|---|---|---|
| Total | 100 | 100 | 100 |
| Below $1,000 | 5.7 | 6.2 | 6.5 |
| $1,000 – $1,999 | 4.6 | 4.6 | 4.5 |
| $2,000 – $2,999 | 4.3 | 4.8 | 4.6 |
| $3,000 – $3,999 | 4 | 4.4 | 4.6 |
| $4,000 – $4,999 | 4 | 4.3 | 4.5 |
| $5,000 – $5,999 | 4.2 | 3.9 | 4.5 |
| $6,000 – $6,999 | 3.8 | 4.2 | 4.2 |
| $7,000 – $7,999 | 3.7 | 4 | 4.2 |
| $8,000 – $8,999 | 3.4 | 4 | 4 |
| $9,000 – $9,999 | 3.6 | 3.6 | 3.9 |
| $10,000 – $10,999 | 3.6 | 3.8 | 4 |
| $11,000 – $11,999 | 3.5 | 3.7 | 3.6 |
| $12,000 – $12,999 | 3.5 | 3.6 | 3.5 |
| $13,000 – $13,999 | 3.3 | 3.6 | 3.6 |
| $14,000 – $14,999 | 3.2 | 3 | 3 |
| $15,000 – $17,499 | 7 | 6.7 | 7.1 |
| $17,500 – $19,999 | 5.9 | 5.7 | 5.7 |
| $20,000 & Over | 28.7 | 25.8 | 23.9 |
6) The bottom 10% of households had a monthly market income of $1,196, while the top 10% had $40,304
Split resident households into 10 equal groups by income, and the gap between the ends is stark. The bottom 10% averaged $1,196 a month in 2025. The top 10% averaged $40,304.
| Deciles | Average Monthly Household Market Income |
|---|---|
| Total (mean) | $16,159 |
| 1st (Lowest) | $1,196 |
| 2nd | $4,417 |
| 3rd | $7,436 |
| 4th | $9,868 |
| 5th | $12,758 |
| 6th | $15,771 |
| 7th | $19,022 |
| 8th | $22,920 |
| 9th | $27,896 |
| 10th (Highest) | $40,304 |
It’s tempting to read that bottom decile as working families in hardship. Look at who is actually in it. Under the new market income definition, 49.3% of the lowest decile were households made up entirely of non-employed people aged 65 and over. Within that decile, 19.8% employed a domestic worker, 6.7% lived in private property, and 5.5% owned a car.
Most of these are retirees living off savings, and savings don’t show up in market income. A low market income doesn’t always mean a low standard of living.
7) Household members in smaller homes received $16,519 a year in government transfers in 2025
Government transfers do a lot of work at the lower end. Households in HDB 1- and 2-room flats received an average of $16,519 per member in 2025, more than double the $7,300 average across all resident households. All transfer figures here are annual amounts per household member.
The overall average fell 5.5% from 2024, mainly because several one-off schemes ended, including the MediSave Bonus and Retirement Savings Bonus under the Majulah Package, and the Budget 2024 Cost-of-Living Special Payment.
| Year | Total | HDB 1- & 2- Room Flats | HDB 3-Room Flats | HDB 4-Room Flats | HDB 5-Room & Executive Flats | Condominiums & Other Apartments | Landed Properties |
|---|---|---|---|---|---|---|---|
| 2025 | 7,300 | 16,519 | 8,383 | 7,179 | 6,814 | 4,173 | 4,348 |
| 2024 | 7,725 | 17,075 | 9,000 | 7,666 | 7,299 | 4,230 | 4,633 |
| 2023 | 6,269 | 13,856 | 7,062 | 6,216 | 5,968 | 3,595 | 3,877 |
| 2022 | 5,752 | 12,346 | 6,477 | 5,645 | 5,518 | 3,536 | 3,719 |
| 2021 | 5,181 | 11,490 | 5,546 | 5,077 | 4,962 | 3,303 | 3,524 |
| 2020 | 6,240 | 13,752 | 7,199 | 6,183 | 5,907 | 3,587 | 3,664 |
| 2019 | 4,528 | 10,577 | 4,737 | 4,397 | 4,447 | 2,834 | 3,032 |
| 2018 | 4,458 | 10,453 | 4,615 | 4,324 | 4,382 | 2,826 | 3,073 |
| 2017 | 4,337 | 10,342 | 4,396 | 4,252 | 4,242 | 2,782 | 3,118 |
| 2016 | 4,173 | 9,993 | 4,202 | 4,053 | 4,141 | 2,632 | 2,819 |
| 2015 | 3,866 | 9,415 | 3,708 | 3,719 | 3,975 | 2,469 | 2,765 |
These transfers, along with taxes, are also what narrows income inequality here. The Gini coefficient on market income fell to 0.452 in 2025, and to 0.379 once transfers and taxes are counted. Both are the lowest since the series began in 2015. Households up to the 7th decile received more in transfers than they paid in taxes.
8) 13.4% of households earned $30,000 or more a month, almost double the share 5 years ago
According to the General Household Survey 2025, published on 30 June 2026, 13.4% of resident households had a monthly market income of $30,000 or more in 2025, up from 7.4% in 2020.
This was not only a top-end story. More than half of all households (51.6%) earned at least $12,000 a month in 2025, against 38.2% five years earlier.
The survey also breaks income down by ethnic group, which the annual KHIT paper doesn’t. All three major groups recorded real income growth between 2020 and 2025.
| Ethnic Group | Median Monthly Household Market Income (2025) | Real Growth Per Year (2020 to 2025) |
|---|---|---|
| Indian | $13,382 | 3.5% |
| Chinese | $12,969 | 3.1% |
| Malay | $8,581 | 2.3% |
9) 56.6% of married couples were dual-income households
Both spouses were working in 56.6% of married couples in resident households in 2025, up from 52.5% in 2020, according to the same survey.
Couples where only the husband worked fell from 24.9% to 21% over those five years. The share where only the wife worked barely moved, at 7.5%.
That partly explains the income growth in the earlier sections. More households simply have two pay cheques coming in now.
What’s Next?
Earning more solves a lot of financial problems. It’s rarely the fastest lever, though. Keeping your expenses in check, building a proper emergency fund, and putting spare cash to work through investments all leave you with more to use, without needing a pay rise.
Then there is the part people put off: making sure that income is protected if you cannot work. If you have no coverage in place, or you’re not sure whether what you have is enough, you can speak with us for a comprehensive financial planning consultation covering your income and your loved ones.
BEFORE YOU GO
Articles can tell you what generally makes sense. They can't see your policies, your CPF, or your plans.
FullCircle is our comprehensive financial planning session. A licensed consultant goes through what you have, shows you the gaps and overlaps, and tells you what to prioritise across protection, retirement, and estate planning.
It's complimentary, takes about 45 minutes, and if nothing needs changing, we'll say so.