Have you been spending more or less during the COVID-19 pandemic?
Some Singaporeans mentioned they’ve been saving more, while some say they have been spending more.
We were curious to find out how the pandemic changed the landscape of consumer spending in Singapore.
In this article, we present the most updated findings, including interesting consumer spending statistics, habits, and patterns in Singapore.
Read on to find out more!
What Is Consumer Spending?
Consumer spending can be known by many names, such as private consumption, personal expenditure, etc.
In Singapore, the term “Private Consumption Expenditure (PCE)” is used. It measures the purchases of goods (durable & non-durable) and services made by resident households and non-profit institutions serving households. Data on PCE are compiled by the Singapore Department of Statistics and published annually here.
PCE’s data include different types of variables:
- Food & Non-Alcoholic Beverages
- Alcoholic Beverages & Tobacco
- Clothing & Footwear
- Housing & Utilities
- Furnishings, Household Equipment, & Routine Household Maintenance
- Health
- Transport
- Communication
- Recreation & Culture
- Education
- Food-Serving Services
- Accommodation Services
- Miscellaneous Goods & Services
The total PCE in Singapore also includes residents’ expenditures abroad but does not include non-residents’ expenditures locally.
In most countries, including Singapore, consumer spending typically comprises the majority of gross domestic product (GDP), and is an important driving force of a country’s economy.
To illustrate, if everyone were to stop spending, businesses would fail and lay off employees. The government would then have no one to tax and would be unable to build the nation. On the other hand, if there were an increased consumer demand, businesses might not be able to cope with that demand, thereby raising prices of their goods and services, possibly leading to high inflation.
Let’s look at some of the statistics on consumer spending.
SIDE NOTE
A policy bought years ago. Savings in three places. A will that's still on the to-do list.
None of it is wrong. It's just not a plan yet.
There's an order that turns the pieces into one system, and it doesn't require becoming a finance expert. Here's the order, in 7 steps, so you know what to sort out first.
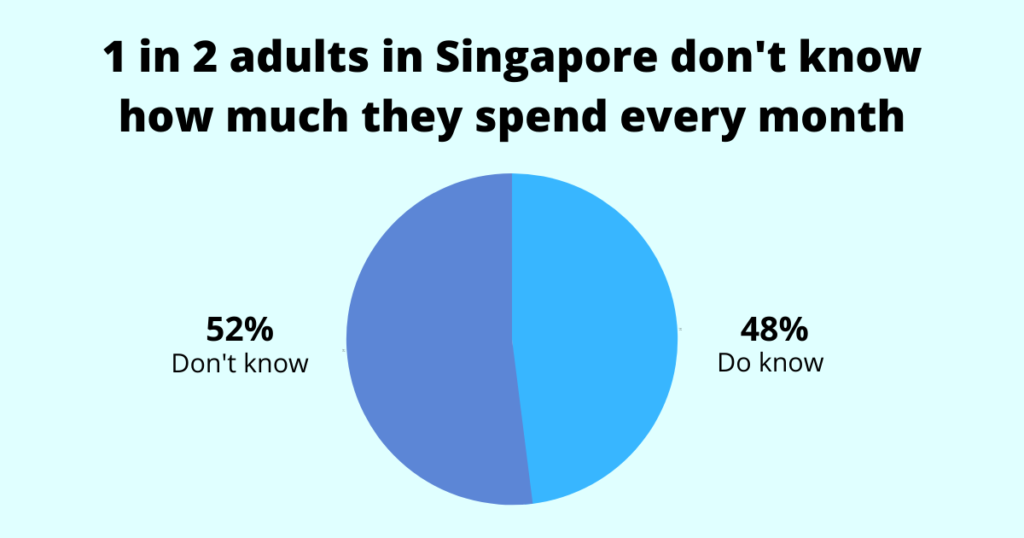
1) 1 in 2 adults in Singapore don’t know how much they spend every month
Data on consumer spending are compiled by the national statistical office on a national level.
But individually, do people in Singapore know how much they spend?
We conducted a survey of 948 adults and found out that about one in two (52%) are clueless as to how much they’re spending every month.
Knowing how much and on what you’re spending are good financial habits to have. Knowing these values will allow you to make improvements such as cutting out unnecessary expenses or finding better or cheaper alternatives. Although this can be a hassle, it plays a pivotal role in financial planning.
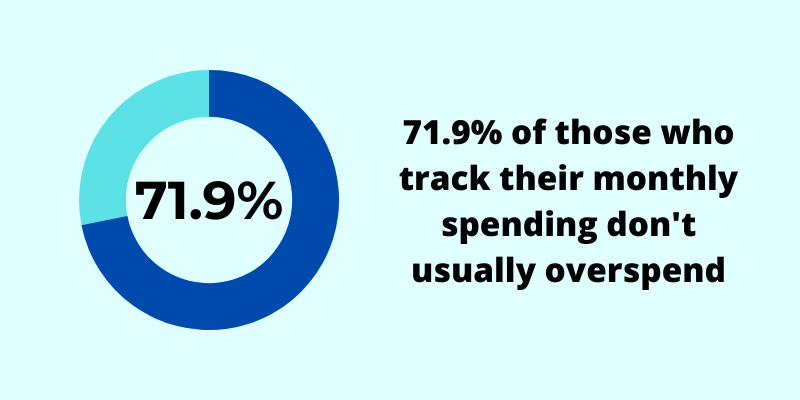
In fact, of those who do track their monthly spending, an overwhelming 71.9% of respondents say they don’t usually overspend.
2) Total consumer spending in Singapore has increased by 123.4% since 2000
Private consumption expenditure has increased significantly throughout the decades, from $69,325.8 million in 2000 to $154,845.7 million in 2020, an increase of 123.4%.
| 2000 | 2001 | 2002 | 2003 | 2004 | 2005 | 2006 | 2007 | 2008 | 2009 | 2010 | 2011 | 2012 | 2013 | 2014 | 2015 | 2016 | 2017 | 2018 | 2019 | 2020 | |
| Private Consumption Expenditure | 69,325.80 | 74,401.50 | 76,523.50 | 77,463.80 | 81,658.80 | 84,765.60 | 89,990.90 | 100,259.90 | 109,442.20 | 110,424.50 | 118,817.50 | 128,655.50 | 137,573.70 | 143,685.40 | 149,942.10 | 157,343.70 | 160,687.30 | 166,880.20 | 175,131 | 182,045.50 | 154,845.70 |
During this period of 20 years, consumer spending has seen year-on-year increases, except in 2020, when the COVID-19 pandemic hit. It dropped from an all-time high of $182,045.5 million in 2019 to $154,845.7 million in 2020, a decrease of 14.9%.
Such a drop in consumer spending poses challenges for Singapore’s economy in the years to come.
3) Spending on food and non-alcoholic beverages has risen by 20.2% from 2019-2020
What contributed to the drop in consumer spending of 14.9% from 2019 to 2020? And have any industries gained during this period?
With local and international travel restrictions, residents’ expenditure overseas decreased by 74.4% from 2019 to 2020 ($30,231.4 million to $7,746.4 million). At the same time, non-residents’ domestic expenditure was also reduced by 73.8%, from $27,837.9 million to $7,304.4 million.
But, if we look only at residents’ local spending, here’s what we find.
| (Millions) | ||
| 2019 | 2020 | |
| Food & Non-alcoholic Beverages | 11,724.30 | 14,091.70 |
| Alcoholic Beverages & Tobacco | 3,016.90 | 3,134.50 |
| Clothing & Footwear | 5,614.90 | 4,153.20 |
| Housing & Utilities | 27,797.30 | 27,676.70 |
| Furnishings, Household Equipment & Routine Household Maintenance | 7,411.20 | 7,325.30 |
| Health | 13,234.40 | 12,617.90 |
| Transport | 23,302.10 | 14,436 |
| Communication | 6,711.50 | 5,887.30 |
| Recreation & Culture | 17,802.50 | 11,491.50 |
| Education | 7,133.60 | 7,200.50 |
| Food Serving Services | 13,713.30 | 10,642.10 |
| Accommodation Services | 4,997.60 | 1,787.20 |
| Miscellaneous Goods & Services | 37,192.30 | 33,959.90 |
With lockdowns, social distancing, and other COVID-19 measures, the earnings of most industries have taken a dip with Singaporeans taking a precautionary measure to save more.
The hardest-hit industries are those providing accommodation services (-64.2%), followed by transport (-38.0%), and then recreation & culture (-35.5%). The reduced spending in these industries isn’t surprising as work-from-home continues to be the default (again).
Residents in Singapore are also spending more on necessities.
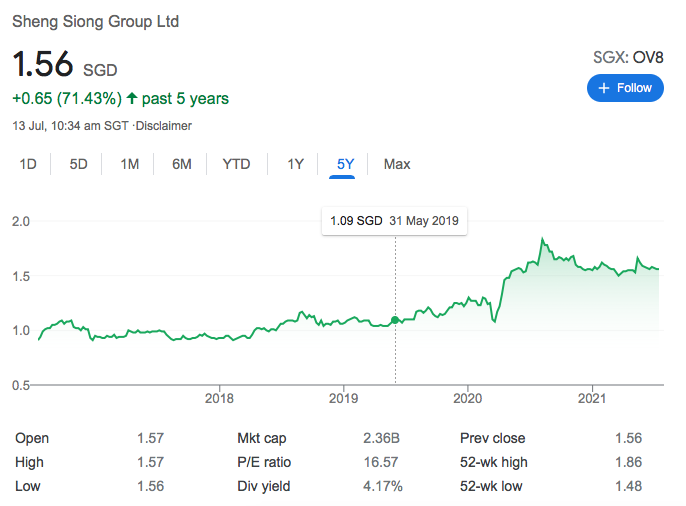
Food and non-alcoholic beverages saw an increase of 20.2% in spending, the greatest increase amongst all industries. This has pushed the share price of Sheng Siong, a chain of supermarkets, to an all-time high of $1.86 on 7 Aug 2020.
Next is alcoholic beverages & tobacco with an increase of 3.9%. Perhaps these are what people are turning to with the lack of entertainment outside their homes.
The education industry has also seen an increased spending of 0.9%.
Such trends in spending are not just unique to Singapore, but can be seen in other parts of the world.
QUICK CHECK
Can you answer these three questions?
1) If something happened to you tomorrow, how much would your family receive?
2) At 65, what monthly income will your savings and investments pay you?
3) If you never get round to a will, who inherits what, and in what proportion?
Most people manage one at best. Not because they're careless, but because nobody has shown them which order to tackle things in.
That order exists. Work through your finances in this sequence, from income and protection through to investments and estate planning.
4) There’s an upward trend of consumers going online
With lockdowns and restrictions, consumer behaviour has changed drastically.
More people are staying (and working) at home, which has led to an increase in consumer consumption online and in the heartlands, while businesses in the Central Business District (CBD) and other business locations have suffered a sharp drop in sales.
According to a report by the Asia Competitiveness Institute (ACI), a research centre at the Lee Kuan Yew School of Public Policy, and Mastercard, it was noted that during the circuit breaker, online shopping (i.e., e-commerce sales) rose from 20% to 30% of retail transactions, while offline spending dropped from 80% to 70%. The report also stated that the trend is unlikely to reverse; however, a 50/50 split between online and offline spending may never happen.
Brick-and-mortar businesses had to pivot and create an online presence; not doing so put them at risk of being left behind. Other businesses had to accelerate their digitalisation plans.
In the financial services industry, where offline customer engagements used to be the norm, going digital meant more communications being done online through WhatsApp, calls, Zoom meetings, etc.
Will digitalisation stay? The emphasis of it by the government says a lot. Singapore will spend about S$3.8 billion on information and communications technology (ICT) in 2021, an increase of about 10% from a year ago.
With more businesses, big or small, having a greater online presence, it’s expected that consumer spending patterns and expectations will shift towards online channels.
5) The average monthly household expenditure is S$4,906
The Singapore Department of Statistics has been conducting a Household Expenditure Survey every five years since 1972/73. The findings provide detailed data on how households are spending their money. The latest survey was done in 2017/18. Although dated, it’s still insightful.
Here are the average monthly household expenditures over the years:
| Year | Average monthly household expenditure |
| 2007/08 | $3,809 |
| 2012/13 | $4,724 |
| 2017/18 | $4,906 |
In 2017/18, the average household expenditure per month was $4,906, an increase of 0.8% per year from the $4,724 in 2012/13. The rising cost of living could play a part.
And here are the average monthly expenditures per household member:
| Year | Average monthly household expenditure per member |
| 2007/08 | $1,158 |
| 2012/13 | $1,450 |
| 2017/18 | $1,628 |
In 2017/18, household members spent an average of $1,628 each, up 12.3% from 2012/13.
6) $1,199 of monthly household expenses are spent on food
Here’s a breakdown of how much is spent on each category per month:
| Category | Monthly expenditure |
| Food | $1,199 |
| Transport | $781 |
| Housing and related | $708 |
| Recreation and culture | $379 |
| Educational services | $339 |
| Health | $323 |
| Communication | $240 |
| Clothing and footwear | $123 |
| Accommodation services | $70 |
| Others | $744 |
Food comprises the highest portion at $1,199 per month. The next highest is transport at $781 and third is housing and related expenses at $708 (this figure doesn’t include imputed rental of owner-occupied accommodation).
7) Households where the main income earner is aged 40-44 spent the most per month
| Age group of main income earner | Average monthly expenditure |
| Below 25 | $4,200.8 |
| 25-29 | $4,549.2 |
| 30-34 | $5,228.6 |
| 35-39 | $5,563.1 |
| 40-44 | $6,039.8 |
| 45-49 | $5,733.4 |
| 50-54 | $5,758.5 |
| 55-59 | $4,713.4 |
| 60-64 | $3,822.9 |
| 65 & over | $2,699.2 |
From the table, we can see how much consumers are spending based on their age. Household expenditures start off lower ($4,549.2) when the main income earner is young, and reach the highest point at $6,039.8 per month at age 40-44. Expenditures reduce gradually until they reach their lowest value ($2,699.2) for the age group of 65 years and beyond.
How Can You Reduce Your Personal Spending and Save More?
Increased or decreased consumer spending can affect Singapore’s economy.
But does it really matter to you? Probably not. What matters is your own spending, not of others.
With bad spending habits, you’re bound to have money leaking away, and eventually, when you need it the most (for your retirement or to send your child to university), you may not have enough.
To start, make it a habit to budget your money and keep track of your spending. Doing both will ensure that you don’t overspend, and you’ll save more at the end of the month.
And with the excess money you’ve saved, don’t forget to put it into good use rather than putting it all in the bank.
BEFORE YOU GO
Articles can tell you what generally makes sense. They can't see your policies, your CPF, or your plans.
FullCircle is our comprehensive financial planning session. A licensed consultant goes through what you have, shows you the gaps and overlaps, and tells you what to prioritise across protection, retirement, and estate planning.
It's complimentary, takes about 45 minutes, and if nothing needs changing, we'll say so.